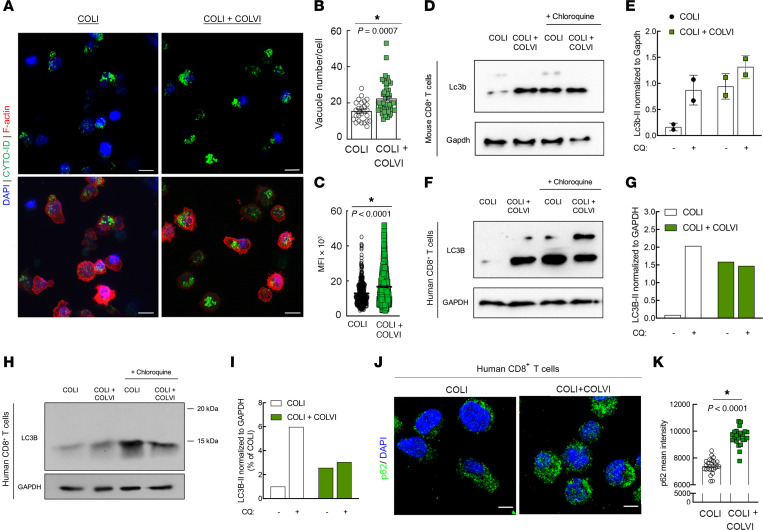
Figure 6. ColVI disrupts CD8+ T cell autophagic flux.
(A–C) Visualization (A) and quantification (B and C) of autophagosomes in CD8+ human T cells cultured on hydrogels containing purified COLI with or without purified COLVI; 2-tailed unpaired t test. (D and E) Western blot (D) and quantification (E) of Lc3b-II expression in murine CD8+ T cells cultured on purified COLI-containing hydrogels in the presence or absence of purified COLVI, with or without chloroquine (CQ) treatment; 2-tailed unpaired t test; n = 2; SD. (F and G) Western blot (F) and quantification (G) of LC3B-II expression in human CD8+ T cells cultured on purified COLI-containing hydrogels in the presence or absence of purified COLVI, with or without CQ treatment. (H and I) Western blot (H) and quantification (I) of LC3B-II expression in human CD8+ T cells cultured on purified COLI-containing hydrogels in the presence or absence of purified COLVI, with or without CQ treatment. Molecular weight marker positions are shown to demonstrate that the single LC3B band detected in this experiment corresponds to the reported molecular weight for LC3B-II (14–16 kDa for LC3B-II vs. 16–18 kDa for LC3B-I). Samples from F–I were generated from cells from different donors, and are shown separately because the analyses were conducted at different institutions using different detection methods (digital fluorescent detection vs. chemiluminescence on film). (J and K) Representative images (J) and quantification (K) of p62 immunofluorescence in human CD8+ T cells cultured on purified COLI-containing hydrogels with or without purified COLVI; 2-tailed unpaired t test. Scale bars: 10 μm (A); 15 μm (J).

