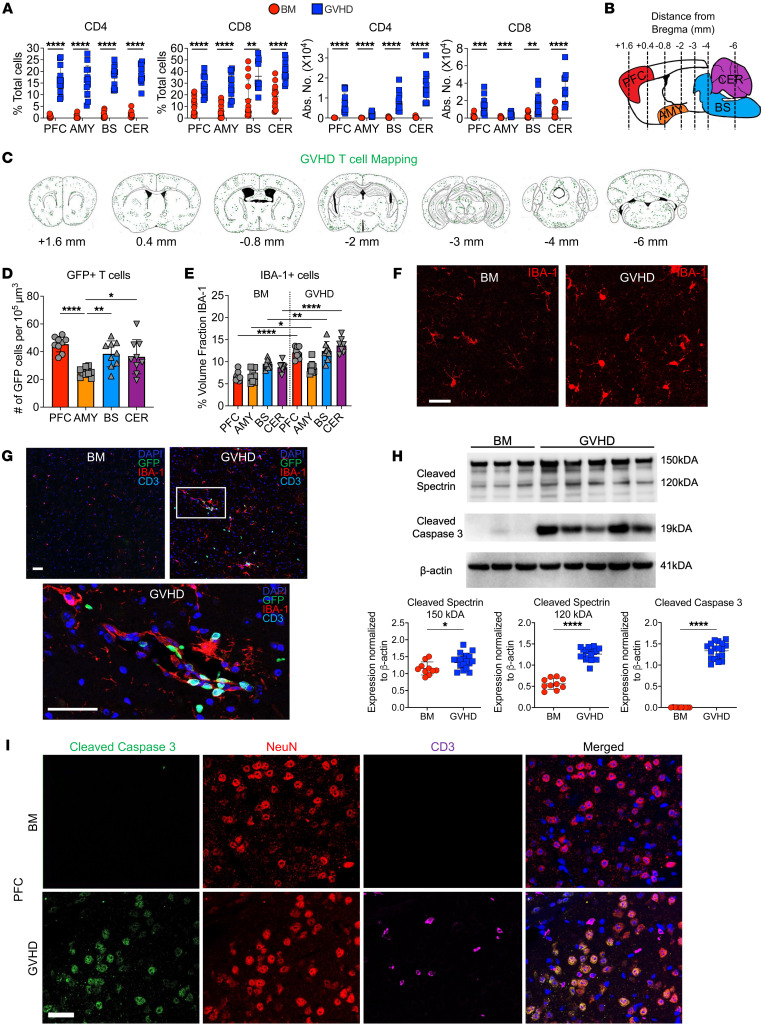
Figure 1. Donor T cells disseminate widely throughout the brain and induce neuronal cell death during GVHD.
(A) Lethally irradiated Balb/c mice were transplanted with B6EGFP BM alone or B6EGFP BM and B6EGFP spleen cells (adjusted to yield an αβ T cell dose of 0.75 × 10⁶). The percentage and absolute number of donor CD4+ and CD8+ T cells in the prefrontal cortex (PFC), amygdala (AMY), brainstem (BS), and cerebellum (CER) 14 days after transplantation. Results are from 3 experiments (n = 13 mice/group). (B–G) Balb/c mice were transplanted with B6 Rag-1 BM alone (BM) or with purified splenic B6EGFP CD4+ (0.9 × 10⁶) and CD8+ (0.55 × 10⁶) T cells (GVHD). (B) Sagittal graphical representation of the brain depicting the location of specified regions along with the distance (in millimeters) from the bregma that selected coronal slices were examined to assess donor T cell infiltration. (C) Distribution of GFP-labeled T cells in specified coronal sections of GVHD mice 14 days after transplantation. (D) The number of GFP+ T cells in specified brain regions per 105 um3. (E and F) Number of IBA-1+ cells in brain regions of GVHD animals depicted as the percentage of the area fraction (E) and representative immunofluorescence images (F). Scale bar: 30 μm. Results are from 2 experiments (n = 8 mice/group). (G) Representative immunofluorescence images depicting colocalization of GFP+ T cells and IBA-1+ cells in the PFC. Scale bar: 30 μm. (H). Representative Western blot images and scatterplots depicting normalized expression of cleaved spectrin (150 and 120 kDA) and cleaved caspase 3 in the brain from Balb/c mice transplanted with B6 BM or B6 BM and spleen cells. Results are from 2 experiments (n = 10–18 mice/group). (I) Representative immunofluorescence images showing expression of cleaved caspase 3, NeuN (neurons), and CD3 (T cells) along with merged compilation. Scale bar: 30 μm. Data are presented as mean ± SD and were analyzed using a t test with Welch’s correction. *P < 0.05, **P < 0.01, ***P < 0.001, ****P < 0.0001. Source data are provided as a Supporting Data Values file.

