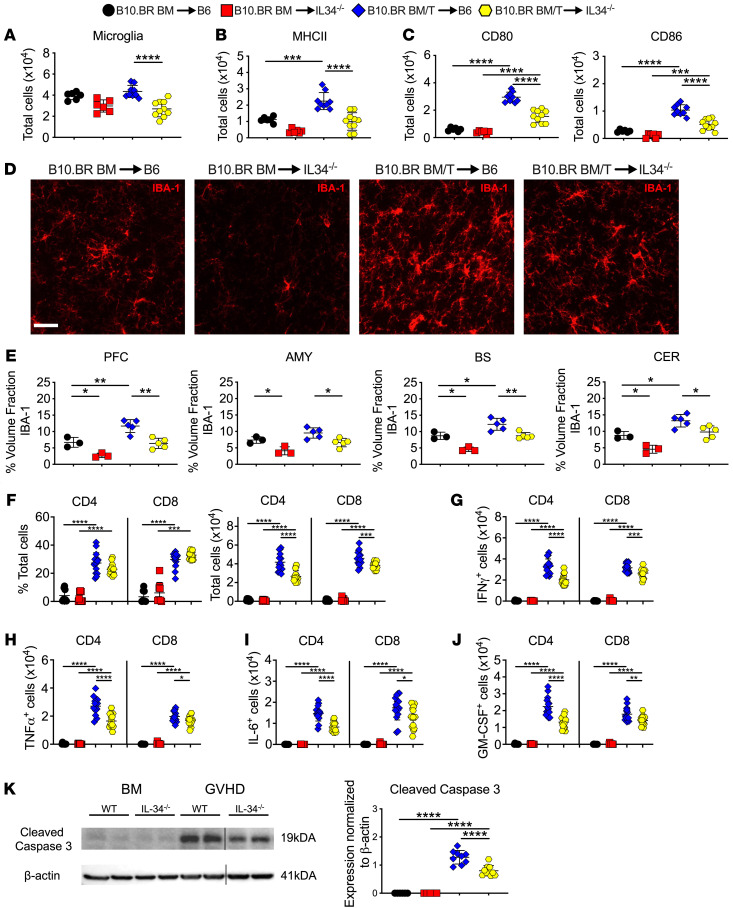
Figure 3. Microglial cells regulate neuronal cell death.
(A–K) Lethally irradiated (1,000 cGy) B6 or IL-34–/– mice were transplanted with B10.BR BM alone or together with B10.BR spleen cells (adjusted to yield an αβ T cell dose of 4 × 10⁶ T cells). (A) Absolute number of microglial cells as defined by expression of CD45lo CD11b+. (B and C) Absolute number of MHC class II, CD80 and CD86 expressing microglial cells. Analysis of microglial cells was performed by flow cytometry. Results are from 2 experiments (n = 6–10 mice/group). (D) Representative immunofluorescence images of IBA-1+ cells in the PFC. Scale bar: 30 μm. (E) Quantification of IBA-1+ cells in the PFC, amygdala, brainstem, and cerebellum (n = 3–5 mice/group). (F–J) The frequency and absolute number of donor-derived CD4+ and CD8+ T cells and the absolute number of CD4+ and CD8+ T cells that produced IFN-γ, TNF-α, IL-6, or GM-CSF in the brains of mice 14 days after transplantation. Analysis of T cells was performed by flow cytometry. Data are from 3 experiments (n = 8–15 mice/group). (K) Representative Western blot images and scatter plots depicting normalized expression of cleaved caspase 3 from B6 or IL-34–/– mice transplanted with B10.BR BM alone or together with B10.BR spleen cells. Results are from 2 experiments (n = 5–10 mice/group). Vertical lines on Western blots denote noncontiguous gel lanes. Data are presented as mean ± SD and were analyzed using a 1-way ANOVA with Tukey’s test for multiple group comparisons. *P < 0.05, **P < 0.01, ***P < 0.001, ****P < 0.0001. Source data are provided as a Supporting Data Values file.

