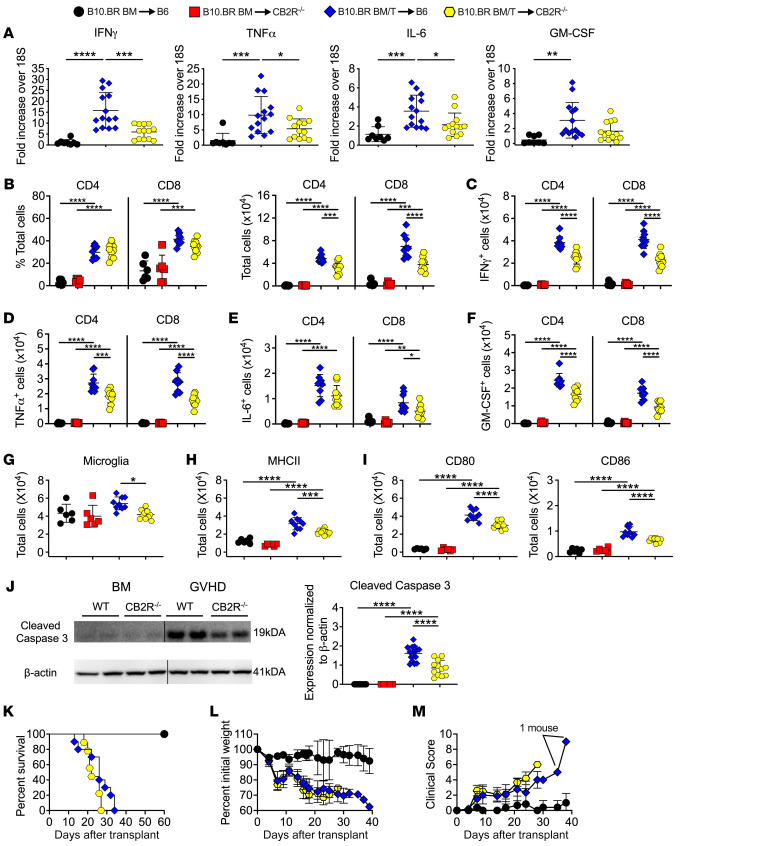
Figure 4. Host CB2R expression regulates neuroinflammation in the brain.
Lethally irradiated (1,100 cGy) B6 or CB2R–/– mice were transplanted with B10.BR BM (5 × 10⁶) together with B10.BR spleen cells (adjusted to yield a αβ T cell dose of 4.5–5 × 10⁶ T cells). B6 animals transplanted with B10.BR BM served as controls. (A) IFN-γ, TNF-α, IL-6, and GM-CSF mRNA expression is depicted in whole brain. Results are from 3 experiments (n = 8–14 mice/group). (B–J) Lethally irradiated B6 or CB2R–/– mice were transplanted with B10.BR BM (5 × 10⁶) alone or together with B10.BR spleen cells (adjusted to yield a T cell dose of 4.5–5 × 10⁶ T cells). (B) The percentage and absolute number of donor-derived CD4+ and CD8+ T cells in the brains of mice 14 days after transplantation. (C–F) The absolute number of CD4+ and CD8+ T cells that produced IFN-γ, TNF-α, IL-6, or GM-CSF. (G) Absolute number of microglial cells. (H and I) Absolute number of MHC class II, CD80, and CD86 expressing microglial cells. Data in panels B–I are from 2 experiments (n = 6–10 mice/group). (J) Representative Western blot images and scatter plots depicting normalized expression of cleaved caspase 3 in the brain from B6 or CB2R–/– mice transplanted with B10.BR BM and spleen cells. Vertical lines on Western blots denote noncontiguous gel lanes. Results are from 2 experiments (n = 8–14 mice/group). (K–M) Lethally irradiated B6 or CB2R–/– animals were transplanted with B10.BR BM and spleen cells. B6 mice transplanted with B10.BR BM alone served as controls. Overall survival (panel K), serial weight curves (panel L), and clinical score (panel M) are shown. Results are from 2 experiments (n = 6–10 mice/group). Data are presented as mean ± SD and were analyzed using a 1-way ANOVA with Tukey’s test for multiple group comparisons. *P < 0.05, **P < 0.01, ***P < 0.001, ****P < 0.0001. Source data are provided as a Supporting Data Values file.

