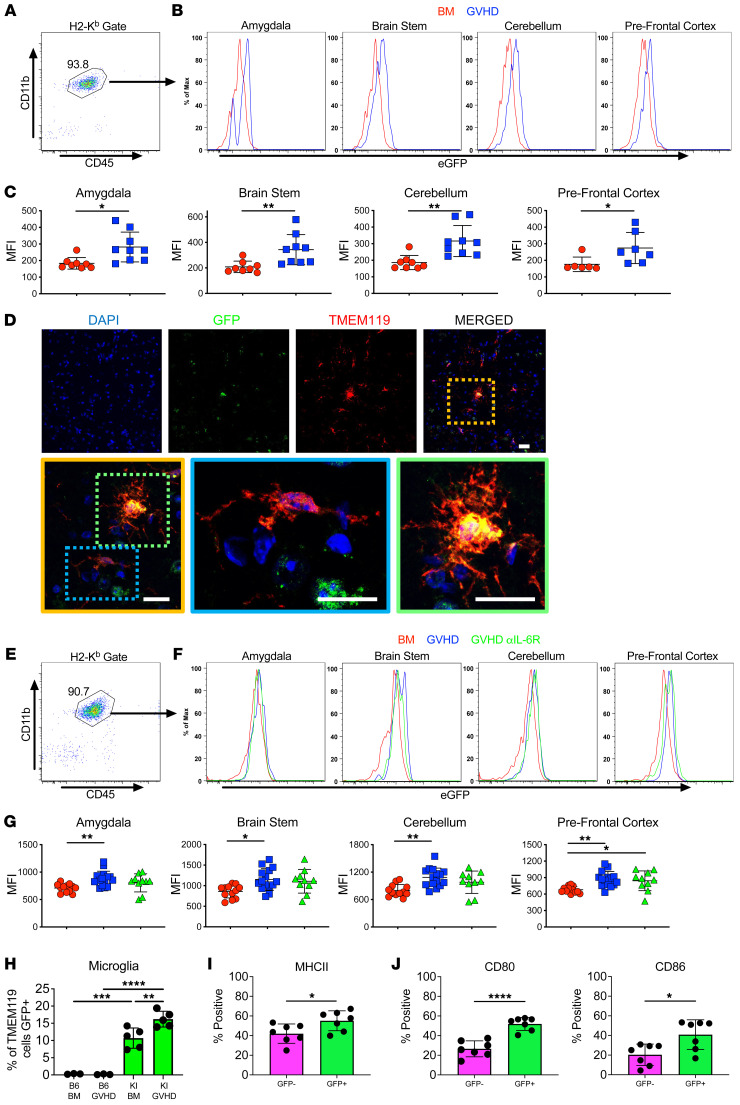
Figure 6. Microglial cell expression of the CB2R induces an activated phenotype and is not regulated by IL-6 signaling.
(A–C) CB2REGFP+ mice were transplanted with B10.BR BM alone or with B10.BR spleen cells. Animals were euthanized 14 days after transplantation. (A) Representative dot plot depicting recipient H-2Kb+ CD45+ CD11b+ microglial cells. (B) Representative histograms depicting EGFP expression on recipient microglial cells from the amygdala, brain stem, cerebellum, and prefrontal cortex of CB2REGFP animals reconstituted with B10.BR BM (BM, red line) or B10.BR BM and spleen cells (GVHD, blue line). (C) Scatterplot showing cumulative median fluorescence intensity (MFI) shifts from 4 replicate experiments. Each data point represents pooled results from 2 mice (n = 8–9 data points). (D) Representative immunofluorescence staining showing CB2R (GFP), microglia (TMEM119), and merged images from the prefrontal cortex of CB2REGFP+ mice transplanted with B10.BR BM and spleen cells. Magnified yellow insert box depicts microglial cell that is CB2R– (blue box) and 1 that expresses the CB2R (green box). Scale bars: 10 μm. (E–G) CB2REGFP+ mice were transplanted with B10.BR BM alone or with B10.BR spleen cells and treated with an anti-IL-6R or isotype control antibody. (E) Representative dot plot depicting recipient H-2Kb+ CD45+ CD11b+ microglial cells. (F) Representative histograms depicting EGFP (CB2R) expression on microglial cells obtained from specified brain regions of CB2REGFP animals reconstituted with B10.BR BM only (BM, red line) or with B10.BR BM and spleen cells and treated with an isotype (GVHD, blue line) or anti-IL-6R antibody (GVHD, αIL-6R, green line). (G) Scatterplot data showing cumulative MFI shifts. Each data point represents pooled results from 2 mice. Results are from 5 experiments (n = 10–15 data points). (H–J) CB2REGFP+ (KI) or B6 mice were transplanted with B10.BR BM alone or with B10.BR spleen cells. Percentage of microglial cells expressing CB2R (EGFP) (H), and frequency of GFP+ (CB2R+) and GFP– (CB2R–) microglia expressing MHC class II, CD80, and CD86 (I and J). Results are from 2 experiments (n = 3–7 mice/group). Data are presented as mean ± SD. Statistics were performed using a t test with Welch’s correction for pairwise comparisons and a 1-way ANOVA with Tukey’s test for multiple group comparisons. *P < 0.05, **P < 0.01, ***P < 0.001, ****P < 0.0001. Source data are provided as a Supporting Data Values file.

