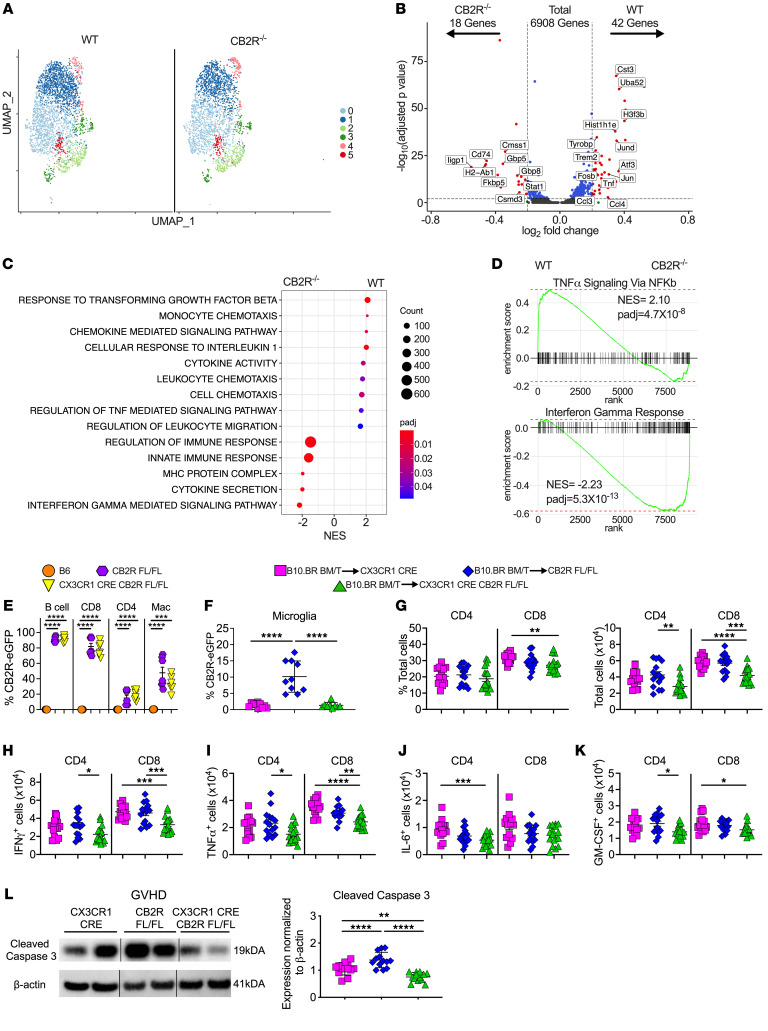
Figure 7. Conditional deletion of CB2R in microglial cells attenuates proinflammatory T cell accumulation and neuronal cell death.
(A–D) B6 or CB2R–/– mice were transplanted with B10.BR BM and spleen cells. Single live microglial cells from pooled brains (n = 5/group) were sorted 14 days after transplantation. (A) UMAP dimensional reduction of scRNAseq data of flow-sorted live cells from pooled brains. Unsupervised clustering using Seurat revealed 6 transcriptionally distinct clusters using a resolution of 0.3. (B) Volcano plot showing over/underrepresented genes in aggregated microglial clusters from B6 versus CB2R–/– mice. Cutoff parameters were |log2(FC)| > 0.2 and Padj < 0.01. (C) Bubble plot demonstrating normalized enrichment score (NES) for pathways identified using the GO database. (D) GSEA using Hallmark database comparing expression of TNF-α signaling and IFN-response genes in microglial cells from B6 versus CB2R–/– mice. (E) Percentage of CB2R expression on splenic B cells, CD8+ T cells, CD4+ T cells, and macrophages in naive, CB2REGFP fl/fl or CX3CR1-Cre CB2REGFP fl/fl mice. Data are from 2 experiments (n = 6–7 mice/group). (F–L). CX3CR1-Cre, CB2Rfl/fl or CX3CR1-Cre CB2Rfl/fl mice were transplanted with B10.BR BM and spleen cells. Mice were euthanized 14 days after transplantation. (F) The percentage of microglial cells that expressed the CB2R based on eGFP expression. Results are from 2 experiments (n = 9–10 mice/group). (G) The percentage and absolute number of donor CD4+ and CD8+ T cells in the brain. (H–K) The absolute number of CD4+ and CD8+ T cells that produced IFN-γ, TNF-α, IL-6, or GM-CSF. (L) Representative Western blot images and summary data depicting normalized expression of cleaved caspase 3. Results are from 3 experiments in panels G–L (n = 13–17 mice/group). Vertical lines on Western blots denote noncontiguous gel lanes. Data are presented as mean ± SD and were analyzed using a 1-way ANOVA with Tukey’s test for multiple group comparisons. *P < 0.05, **P < 0.01, ***P < 0.001, ****P < 0.0001. Source data are provided as a Supporting Data Values file.

