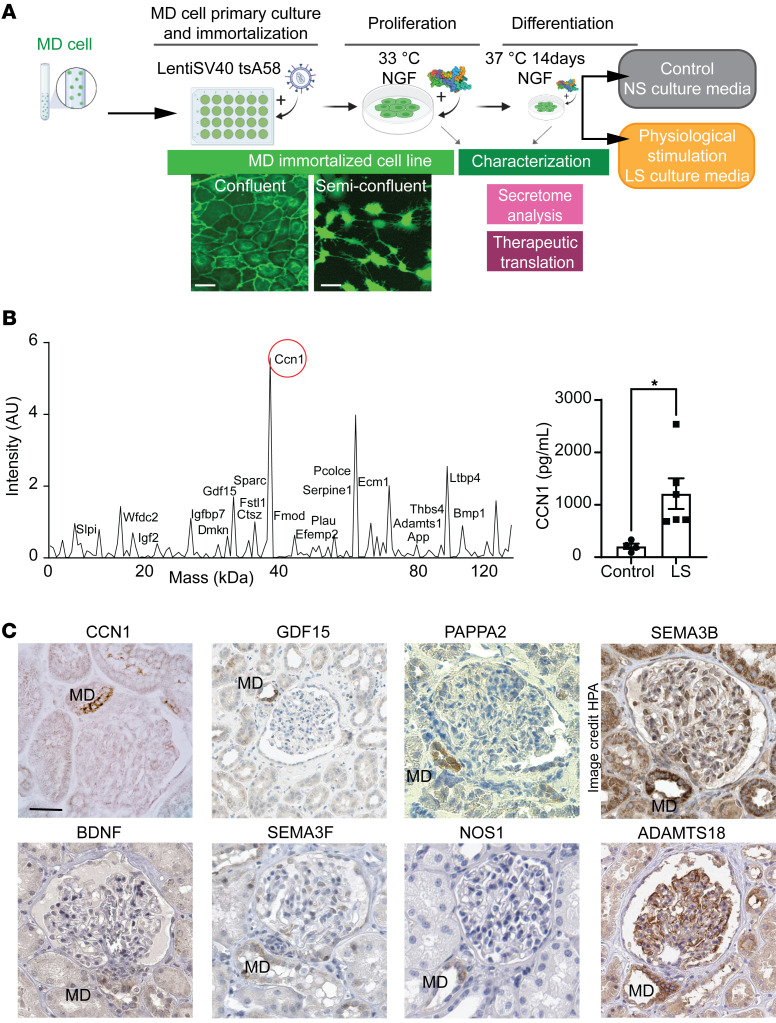
Figure 4. MD cell secretome analysis.
(A) Workflow of the generation and characterization of the MDgeo cell line and its culturing (conditioning) in control (normal salt [NS]) and low salt (LS) conditions. Differentiated mMDgeo cells show an epithelial cobblestone-like pattern, while semiconfluent MDgeo cells feature long axon-like processes. Scale bar: 25 μm. (B) Mass spectrometry (left) and CCN1 ELISA (right) analysis of the LS-conditioned MDgeo cell culture medium. Mass spectrum plot representing the detected MD-derived secreted proteins in the MDgeo cell culture medium as indicated. LS, low-salt medium. Data represent mean ± SEM. *P < 0.05 with t test, n = 4–6. (C) Immunohistochemistry validation of the expression of top enriched mouse MD-specific genes or their homologous isoforms in the human kidney. Data are from the Human Protein Atlas (HPA) where indicated. Image available from https://www.proteinatlas.org/ENSG00000012171-SEMA3B/tissue/kidney Scale bar: 50 μm.

