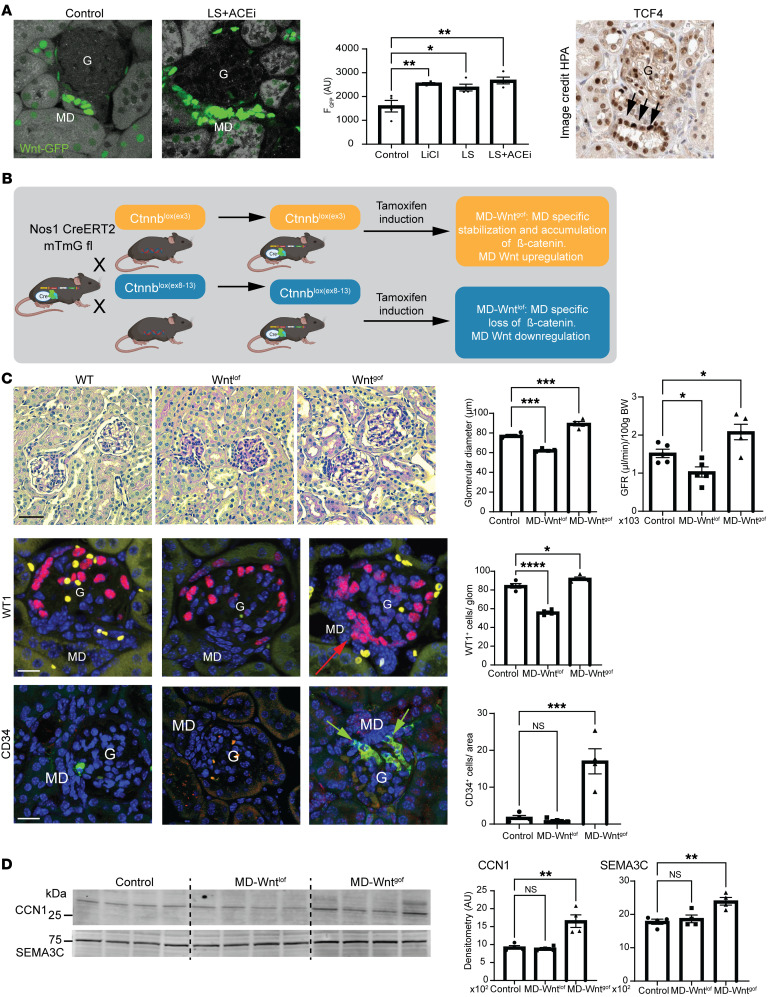
Figure 5. Manipulation of MD Wnt signaling alters glomerular structure and function.
(A) Representative fluorescence images of frozen kidney sections (left) and quantification (center) of Wnt activity (GFP fluorescence [F] intensity, green) from mice with nuclear TCF/Lef:H2B-GFP reporter in control, LiCl (as positive control), LS, and LS+ACEi conditions; n = 4–6 (average of 5 MDs/animal). Intense GFP labeling in MD cells. Right: TCF4 immunohistochemistry in human kidney (data from the Human Protein Atlas [HPA]). Image available from https://www.proteinatlas.org/ENSG00000196628-TCF4/tissue/kidney Intense labeling in MD cells (arrows). G, glomerulus. (B) Illustration of the applied Cre/lox-based breeding strategies to generate inducible MD Wnt gain-of-function (MD-Wntgof) and loss-of-function (MD-Wntlof) mouse models. (C) Top: Renal histological (representative H&E images [left]) and functional (glomerular filtration rate [GFR, right]) features of MD-Wntgof and lof mice 2 months after tamoxifen induction; n = 4–5 (average of 5–10 glomeruli/animal). Note the enlarged or smaller cortical glomeruli in MD-Wntgof and lof mice, respectively, compared with control WT mice, with extracellular (mesangial) matrix accumulation in MD-Wntlof mice. Bottom: Representative immunofluorescence images (left) and statistical summary (right) of WT1+ (red) and CD34+ (green) cell number. Note the high cell density at the macula densa (MD) cell base (arrows). Yellow (in WT1) and orange (in CD34) colors represent the autofluorescence of red blood cells. Scale bars: 25 μm. Nuclei are labeled blue with DAPI. (D) Altered expression of MD-specific proteins in renal cortical homogenates, including CCN1 and SEMA3C; n = 4. Data represent mean ± SEM. *P < 0.05, **P < 0.01, ***P < 0.001, ****P < 0.0001, ANOVA followed by Dunnett’s test.

