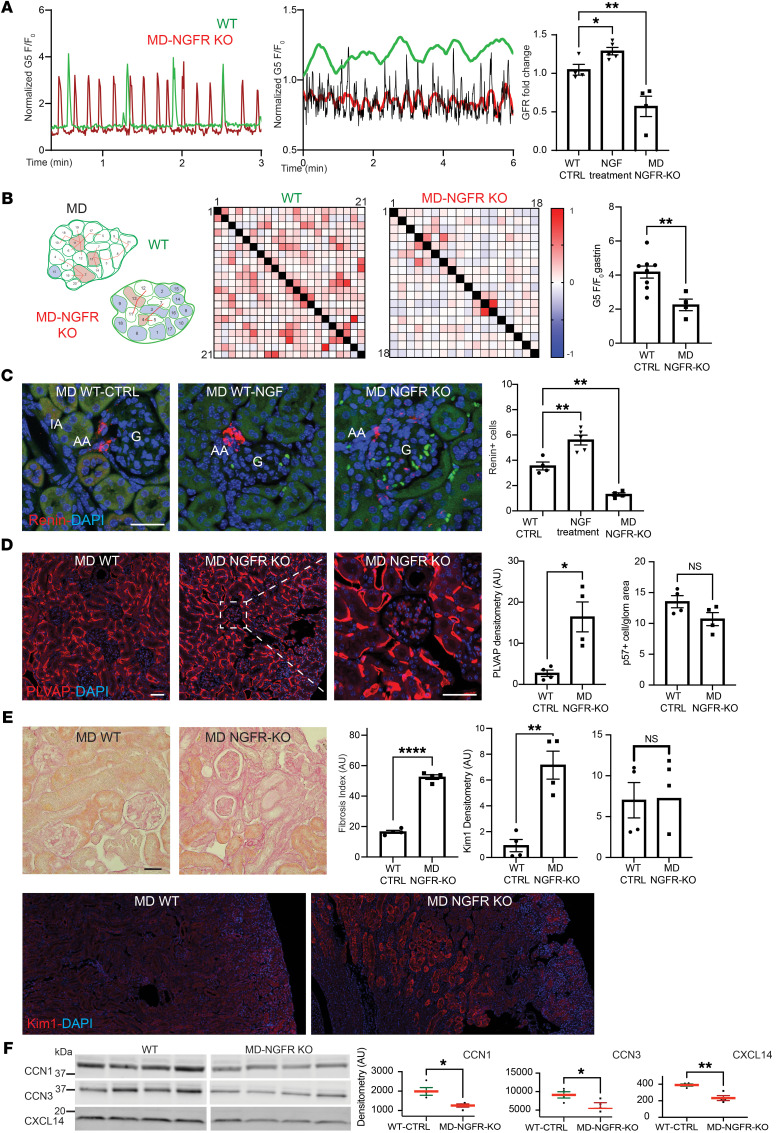
Figure 6. The phenotype of MD-NGFR–KO mice.
(A) Increased frequency of MD cell Ca2+ transients in MD-NGFR–KO vs. WT mice. Single MD cell (left) and whole-MD recording (center, original/smoothed) of G5F transients in WT (green) and MD-NGFR–KO mice (red). GFR changes (normalized to baseline before induction/treatment) in WT treated with vehicle (control) or NGF and MD-NGFR–KO mice (right); n = 4–5. (B) Reduced MD cell connectivity and sensitivity in MD-NGFR–KO vs. WT mice. Left: Functional MD cell–to-cell connectivity map of all 21 (WT) and 18 (MD-NGFR–KO) individually numbered MD cells. Red line connecting individual cell pairs indicates Pearson’s r > 0.35. Red and blue cell color indicates hub and lone cells, respectively. Center: Heatmap of each MD cell pair’s Pearson’s coefficient in 2-color gradient, as in scale. Right: Effect of i.v. gastrin on MD cell Ca2+ (G5F) in WT vs. MD-NGFR–KO mice; n = 4–8 (average of 4–5 MD cells/animal). (C–E) Renin cell density (C), endothelial injury and podocyte number (D), and renal pathology (E) in WT mice treated with vehicle (control) or NGF,and MD-NGFR–KO mice. n = 4–5 (average of 5 glomeruli/animal). Renin, PLVAP, KIM1 immunofluorescence (red) images and PAS-stained kidney tissue sections, and summary of respective cell numbers, labeling density (tissue fibrosis index), and albuminuria (ACR). Cell nuclei are labeled blue with DAPI, tissue autofluorescence (C, green) is shown for tissue morphology. Scale bar: 50 μm (C–E). (F) Representative immunoblots and summary of MD-specific protein expression in renal cortical homogenates, including CCN1, CCN3, and CXCL14 in WT vs. MD-NGFR–KO mice; n = 4. Data represent mean ± SEM. *P < 0.05, **P < 0.01, ***P < 0.001, ****P < 0.0001 using Student’s t test (B and D–F) or ANOVA followed by Dunnett’s test (A and C).

