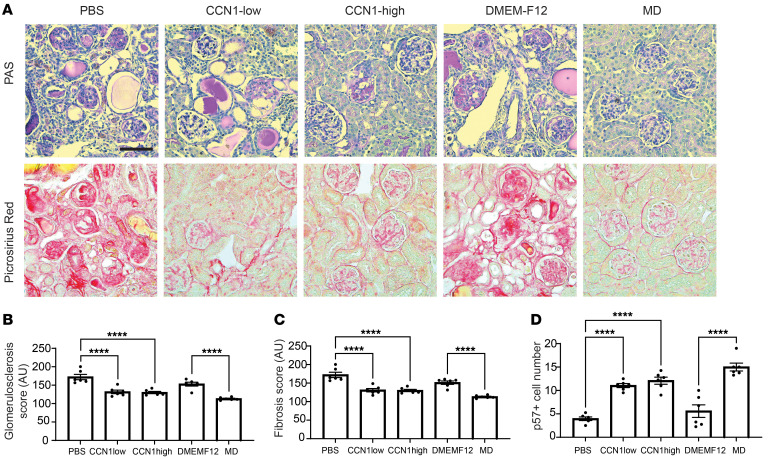
Figure 9. Treatment with MD biologicals improves kidney structure in CKD.
(A) PAS- (top row) and Picrosirius Red–stained (bottom row) histology images of kidney tissues harvested at the end of treatment in all treatment groups. Scale bar: 50 μm. (B–D) Quantification of glomerulosclerosis (B), tubulointerstitial fibrosis (C), and p57+ cell number (podocyte preservation) (D) in all treatment groups; n = 6 (average of 5 areas/animal). Data represent mean ± SEM. ****P < 0.0001, ANOVA with Šidák’s test.

