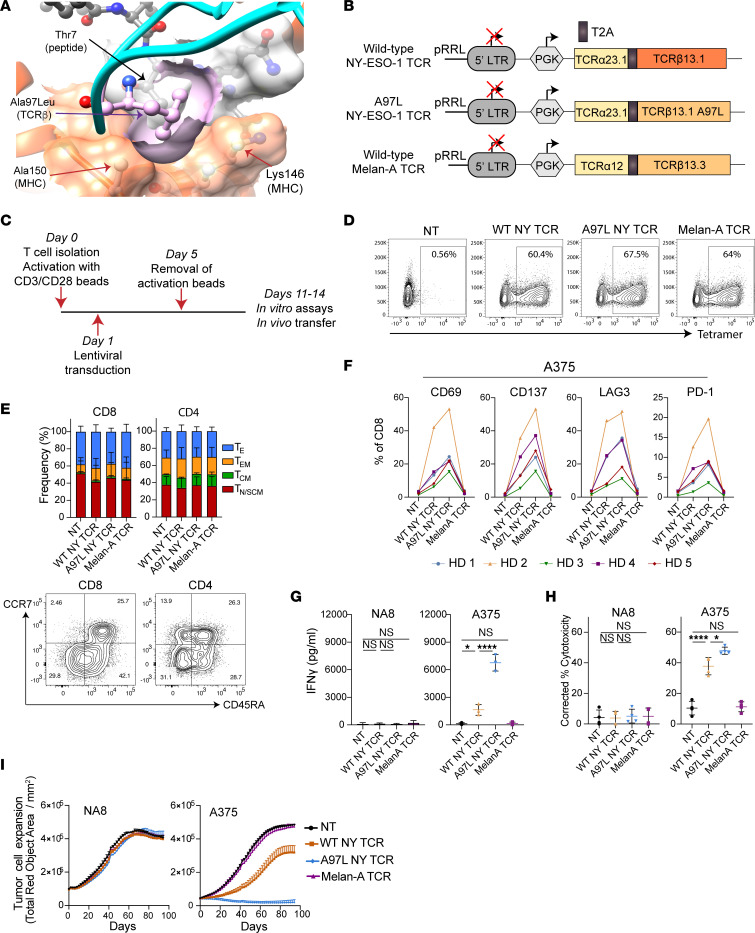
Figure 1. T cells expressing affinity-enhanced A2/NY-TCR A97L exhibit superior effector function in vitro compared with WT.
(A) TCR variant A97L binding to A2/NY-ESO-1157–165 (Protein Data Bank ID 2BNR). A97L replacement in CDR3β (in ball and stick representation, colored in pink) enhances direct peptide contact via non-polar interactions with Thr7 (ball and stick representation, in gray, below TCRβ chain) as well as with MHC-Ala150 and -Lys146 (ball and stick representation, surface in orange). (B) Schematic of lentiviral constructs encoding TCRs. (C) Strategy for T cell activation, transduction, and expansion. (D) Transduction efficiency of CD8+ T cells with TCRs evaluated by tetramer staining (data are representative of 5 donors). (E) Top: Frequency of effector and memory phenotypes of rested CD8+ and CD4+ T cells transduced to express the different TCRs (n = 3). Bottom: Representative flow cytometric analysis of anti-CCR7 and anti-CD45RA Ab–stained T cells (TE, effector; TEM, effector memory; TCM, central memory; TN/SCM, naive/stem cell–like memory). (F) Expression (frequency) of activation markers and checkpoint receptors on CD8+ TCR-engineered T cells 24 hours after stimulation with A375 tumor cells (n = 5). HD, healthy donor. (G) IFN-γ secretion levels by TCR-modified T cells 24 hours after stimulation with NA8 and A375 tumor cells at effector/target ratio (E/T) = 1:1 (n = 3). (H) Frequency of annexin V+ DAPI+ cells, corrected to tumor alone, in 24-hour cocultures of NA8 and A375 tumor cells with TCR-modified T cells at E/T = 1:1 (n = 4). (I) Evaluation of mKate2+ NA8 and A375 tumor cell growth control over time by TCR–T cells at E/T = 1:1 using live-cell IncuCyte imaging (data are representative of 4 donors). Statistical analysis was done by 1-way ANOVA (E, G, and H) with correction for multiple comparisons by post hoc Tukey’s test (E, G, and H). *P < 0.05; ****P< 0.0001.

