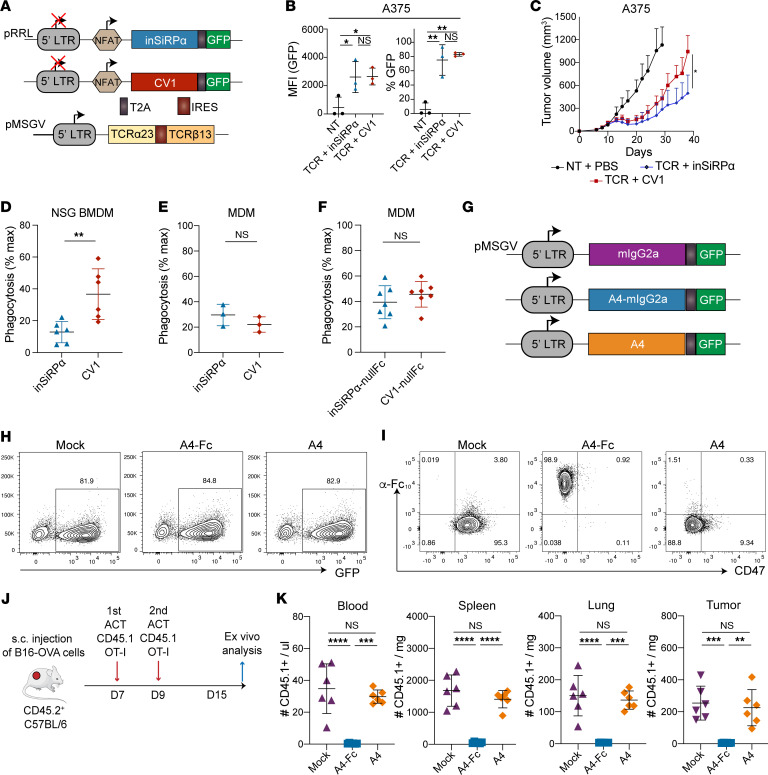
Figure 7. CV1 monomer-coated human T cells are targeted for phagocytosis by NSG but not human macrophages, and engineered murine T cells are only depleted in C57BL/6 mice if the CD47 decoy is fused to an active Fc region.
(A) Schematic of lentiviral vectors encoding SiRPα monomer under 6xNFAT and of a retroviral vector encoding the A97L-TCR. (B) Inducible SiRPα monomer expression by A97L–T cells as detected by EGFP expression upon coculture with target tumor cells (n = 3). (C) A375 tumor control curves following ACT with A97L–T cells coengineered to express inSiRPα- or CV1 monomers under 6xNFAT (n ≥6; data are representative of 2 independent studies). (D) Evaluation of phagocytosis of A97L–T cells coengineered to express inSiRPα or CV1 monomers by BMDMs (n = 6). (E) Evaluation of phagocytosis of A97L–T cells coated with inSiRPα- or CV1 monomers by MDMs (n = 3). (F) Evaluation of phagocytosis of T cells coated with secreted CV1-nullFc by MDMs in vitro (n = 7). (G) Schematic of retroviral constructs encoding A4-Fc and A4 decoys. (H) Expression of A4-Fc and A4 monomer decoys in transduced mouse OT-I T cells, detected by EGFP (data are representative of 3 or more donors). (I) Flow cytometric detection of A4-Fc and A4 monomer binding on OT-I T cells by staining with anti-Fc Ab and anti–mouse CD47 Abs (data are representative of 3 donors). (J) Schematic of ACT against subcutaneous B16-OVA tumors and ex vivo analysis. (K) Frequency and number of mouse CD45.1+ cells in harvested tissues 6 days after ACT (n = 6; data are representative of 2 independent studies). Statistical analysis was done by 1-way ANOVA (B and K), 2-way ANOVA (C), or unpaired 2-tailed t test (D–F) with correction for multiple comparisons by post hoc Tukey’s test (B and K) or post hoc Šidák’s test (C). *P < 0.05; **P < 0.01; ***P < 0.001; ****P< 0.0001.

