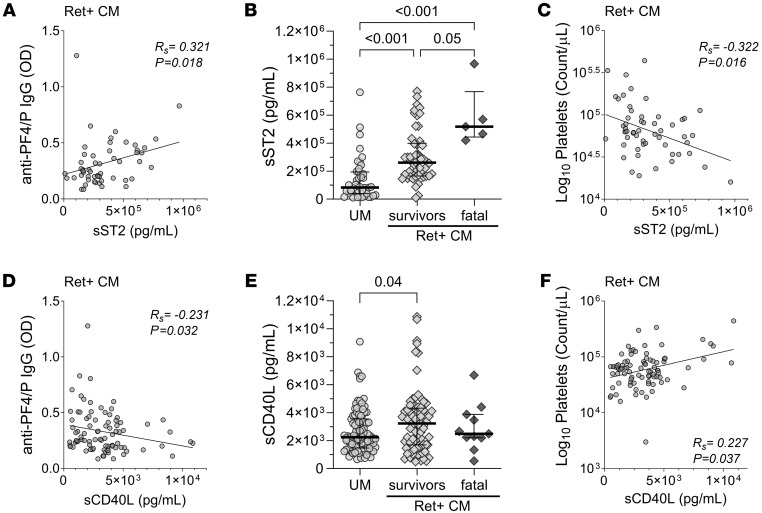
Figure 3. sST2 and CD40L levels, markers of thromboinflammation, link anti–PF4/P IgG levels in Ret+ CM with thrombocytopenia and disease outcome.
(A) Spearman correlation analysis between anti–PF4/P IgG levels and sST2 plasma levels in patients with Ret+ CM (n = 54). (B) Plasma levels of sST2 in patients with UM (n = 43), Ret+ CM survivors (n = 50, and patients with fatal Ret+ CM (n = 5). (C) Spearman correlation analysis between peripheral platelet count and sST2 plasma levels in patients with Ret+ CM (n = 55). (D) Spearman correlation analysis between anti–PF4/P IgG levels and sCD40L plasma levels in patients with Ret+ CM (n = 86). (E) Plasma levels of sCD40L for patients with UM (n = 100), Ret+ CM survivors (n = 76), and patients with fatal Ret+ CM (n = 11). (F) Spearman correlation analysis between peripheral platelet count and sCD40L plasma levels in patients with Ret+ CM (n = 85). For A–D and F, the Spearman’s rho (Rs) coefficient and associated P value are shown within the graphs. For B and E, the median with the IQR are shown for each sample set as a horizontal bar and error bars. Statistical significance in B and E was determined by Kruskal-Wallis test with Dunn’s multiple comparisons.

