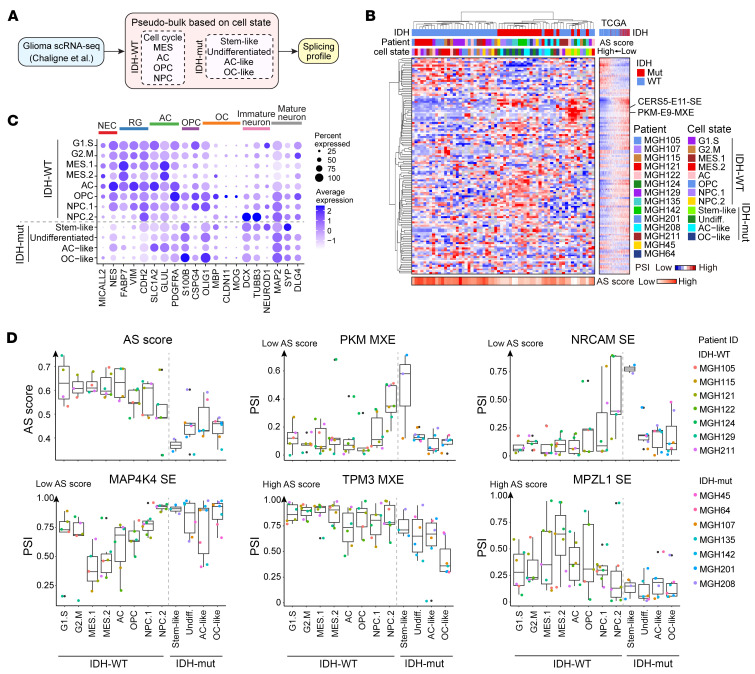
Figure 3. Intratumoral AS heterogeneity is associated with the developmental hierarchy in glioma.
(A) Computational pipeline of AS analysis using a cell-state based pseudobulk strategy in scRNA-Seq data of gliomas. (B) Hierarchical clustering analysis with the PSI data of events in pseudobulks. The heatmap on the right illustrates the PSI data of events at the same order in TCGA samples. (C) Expression of neural lineage markers in each cell state. Dot sizes indicate the percentage of cells in each group expressing the gene, and colors indicate average expression levels. NEC, neuroepithelial cells; RG, radial glia; AC, astrocyte; OPC, oligodendrocyte progenitors; OC, oligodendrocytes. (D) Box plots showing the AS score and PSI distribution of representative AS events in each cell state. The box representing the interquartile range of the data, the line within the box representing the median, and the whiskers extending to the most extreme data points within 1.5 times the interquartile range. Individual data points beyond this range are shown as dots. The color of the dots represents the patient.

