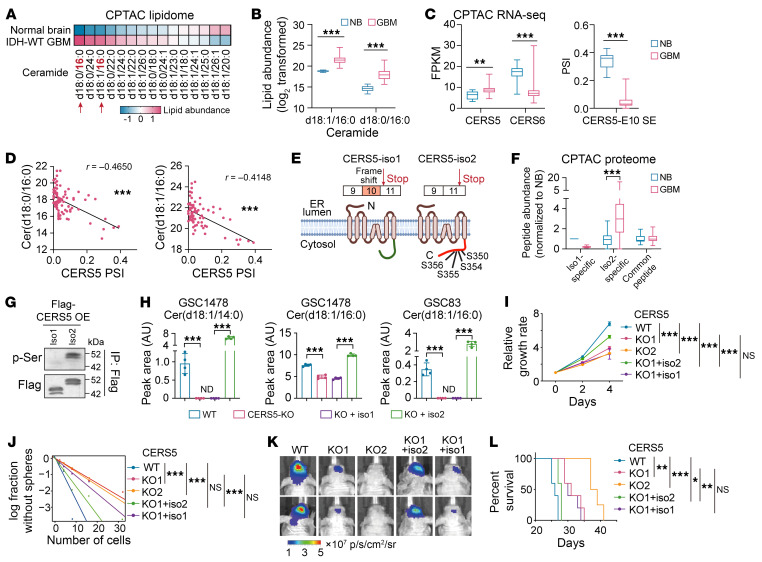
Figure 6. AS of CERS5-E10 affects the ceramide component and oncogenic potential of glioma cells.
(A and B) Ceramide abundance between normal brain and GBM. “d18” represents a sphingoid base with 18 carbons. The number after “:” indicates the presence of double bonds, and the number after “/” denotes the carbon length in the fatty acid chain. (C) Gene expression of CERS5, CERS6 (left) and PSI of CERS5-E10-SE between normal brain and GBM. (D) Spearman correlation analysis between C16-ceramide and PSI of CERS5-E10-SE. (E) A cartoon showing CERS5 isoforms. (F) Abundance of CERS5 peptides analyzed from CPTAC-proteome data. (G) IP-IB in GSC46 overexpressed with CERS5 isoforms. (H) Lipid-MS analysis of ceramides abundance in GSCs. n = 4. ND, not detected. (I–L) Effects of CERS5-KO and rescue on proliferation (I, n = 3–6), sphere-formation (J), xenograft growth of GSC1478 (K, representative BLI at 18 days after inoculation) and mouse survival (L, n = 4–5). Data were analyzed using 2-tailed unpaired t test in B, C, F, and H, 2-way ANOVA in I, likelihood ratio test in J, and log-rank test in L. In B, C, and F, the box represents the interquartile range, the line within the box represents the median, and the whiskers extending to the maximum and minimum values. *P < 0.05; **P < 0.01; ***P < 0.001.

