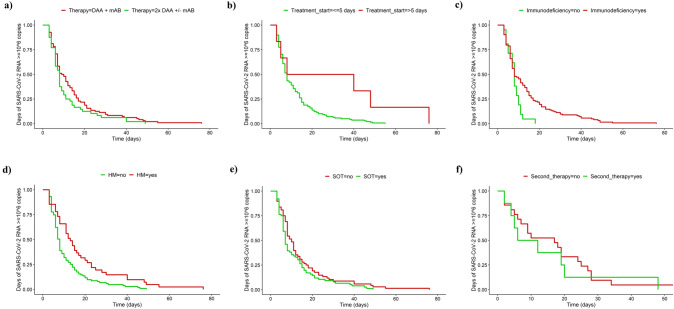
Fig. 2.
Viral Shedding. Kaplan–Meier plots showing the probability of SARS-CoV-2 RNA ≥ 10^6 copies/ml set in relation to time in days. The time of viral shedding was not significantly different between the treatment strategies (a: 1 × DAA + 1 × mAB: 14·0 days vs. 2 × DAA ± 1 × mAB: 11·0 days; p = 0·17). The period was longer in b) patients with a late treatment initiation (> 5 days after diagnosis: 30·7 days vs. ≤ 5 days after diagnosis: 12·3 days; p < 0·01), c) immunocompromised patients (13·9 days vs. 8·0 days in immunocompetent patients; p = 0·04) and/ or d) especially in patients with HM (17·1 days vs. 11·0 days in patients without HM; p < 0·01). In comparison, in patients under immunosuppressive medication following SOT the time was even shorter (11·7 days vs. 14·5 days in patients with no history of solid organ transplantation; p = 0·18). DAA direct acting antiviral, HM haematological malignancies, mAB monoclonal antibody, SOT solid organ transplantation

