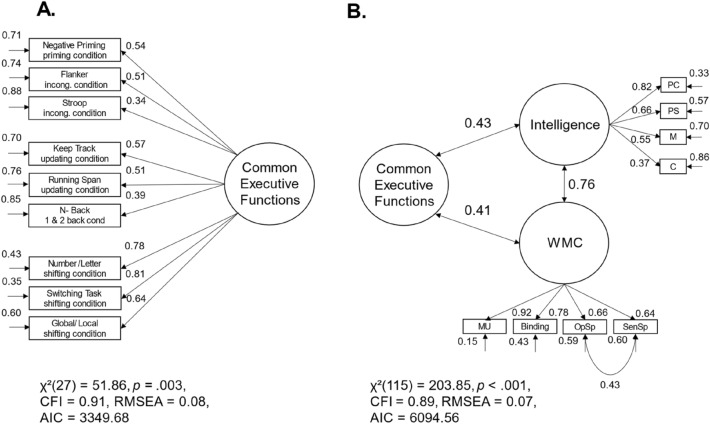
Fig. 4.
Models with one common factor of executive functions with drift rates as homogenous measurement scores. Note. The standardized path weights, the unstandardized residual variances, and the correlation coefficients are shown next to the paths; MU = memory updating; BIS-PC = processing capacity scale of the Berlin Intelligence Structure Test; BIS-PS = processing speed scale of the Berlin Intelligence Structure Test; BIS-M = memory scale of the Berlin Intelligence Structure Test; BIS-C = creativity scale of the Berlin Intelligence Structure Test; WMC = working memory capacity

