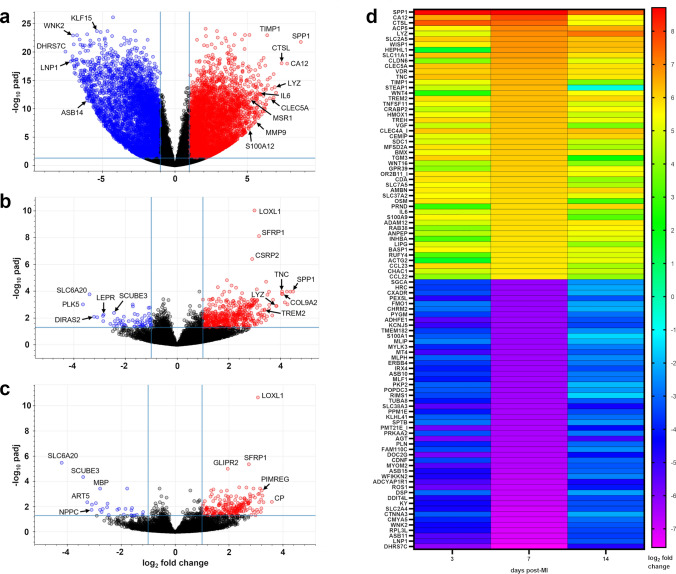
Fig. 7.
Differential gene expression in infarcted porcine myocardium as determined by bulk-tissue RNA sequencing. a–c Volcano plots illustrating significantly (|log2 fold change|≥ 1.0, adjusted p (padj) ≤ 0.05; corresponding cut-off lines in light blue) up- (red) and downregulated (blue) transcripts in a the infarct core, b the border zone, and c the remote zone vs. pooled sham at 7 days post-MI. d Heatmap representing the most differentially up- and downregulated genes in the infarct core at the indicated points in time post-MI. The color scale shows the log2 fold change vs. pooled sham. Transcripts were sorted by log2 fold change on day 7 post-MI. padj ≤ 0.05. All calculations performed in DESeq2 (n = 3–4)

