Fig. 8.
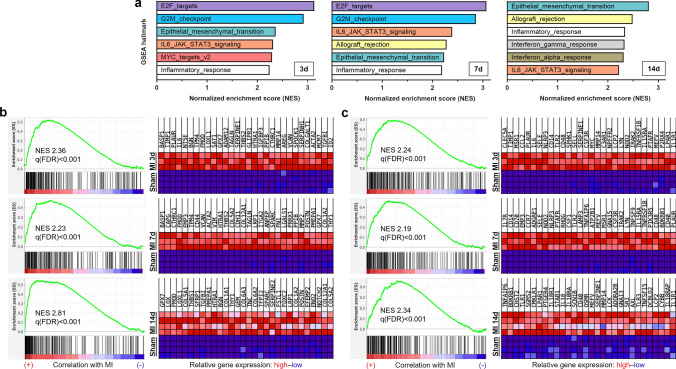
Gene set enrichment analysis (GSEA) of differentially expressed genes in infarcted porcine myocardium as determined by bulk-tissue RNA sequencing. a GSEA of differentially expressed genes using the hallmark gene set collection (Molecular Signatures Database—MSigDB). Bar graphs depict the top 6 hallmark gene sets as ranked by their normalized enrichment score (NES), being significantly (q(FDR) < 0.25) enriched in tissue from the infarct core compared to tissue from sham hearts (n = 3–4) at the indicated points in time (d = days) post-MI. q(FDR): q value indicating the expected false discovery rate (FDR). b–c Enrichment plots and corresponding heatmaps for the hallmark gene sets, b “epithelial–mesenchymal transition”, and c “inflammatory response” at the indicated points in time after MI. Heatmaps show the relative expression of the top 30 genes in each pathway for the respective post-MI and all sham animals

