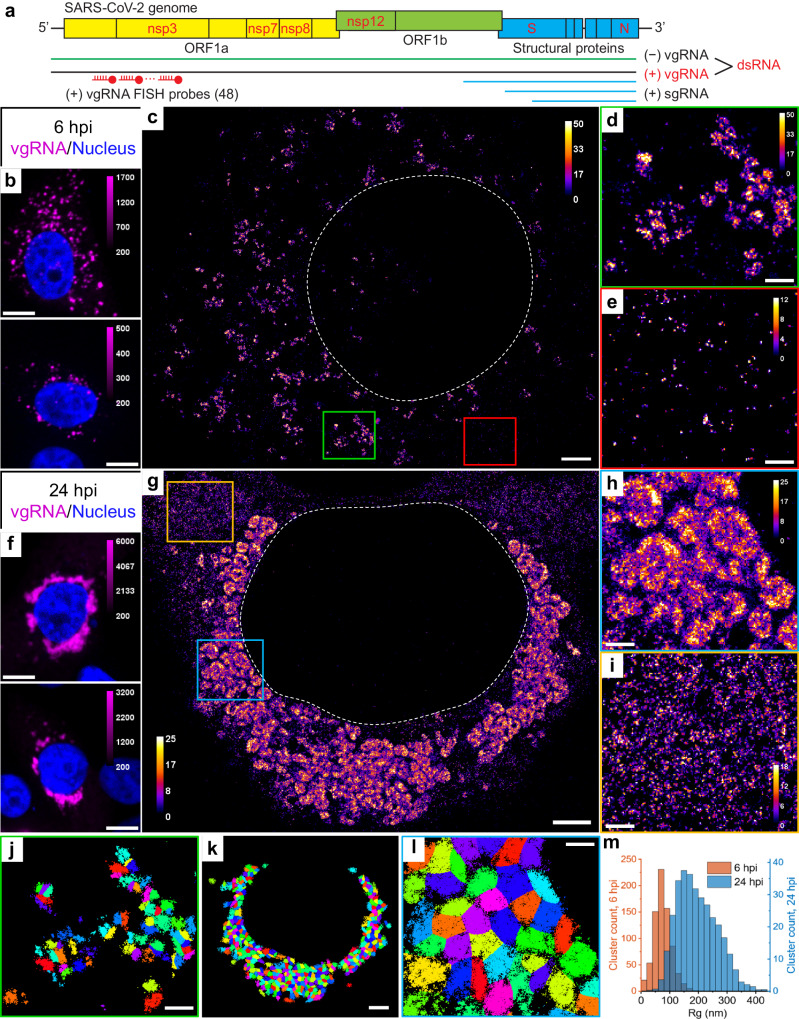
Fig. 1. Clustering of vgRNA in the cytoplasm of infected cells.
a Scheme of SARS-CoV-2 genome with constructs used for its detection in infected cells. 48 antisense DNA oligonucleotide probes were used to target the ORF1a-coding region of vgRNA that is exclusive to the positive-sense vgRNA and does not occur in the sgRNAs. The RNA FISH probes are conjugated with AF647 or CF568. b Representative confocal images of vgRNA in infected Vero E6 cells at 6 hpi display scattered diffraction-limited (DL) puncta. c Representative SR image of an infected cell at 6 hpi reveals distinct vgRNA clusters in the cytoplasm. d Zoomed-in region of the SR image (green frame in c) displays an agglomeration of vgRNA clusters. e Zoomed-in region of the SR image (red frame in c) shows nanoscale puncta of individual vgRNA molecules. f Representative confocal images of vgRNA in infected Vero E6 cells at 24 hpi display large DL foci in the perinuclear region of the cytoplasm. g Representative SR image of an infected cell at 24 hpi reveals large perinuclear vgRNA clusters. h Zoomed-in region of the SR image (blue frame in g) displays dense vgRNA clusters. i Zoomed-in region of the SR image (yellow frame in g) displays nanoscale puncta of vgRNA molecules. j BIC-GMM cluster analysis of the region shown in d. k BIC-GMM cluster analysis of the cell shown in g. l BIC-GMM cluster analysis of the region shown in h. m Histogram of the radii of gyration (Rg) of the vgRNA clusters indicate their size increase between 6 hpi (tan) and 24 hpi (blue). Data for the histograms are obtained from 10 cells (6 hpi) and 16 cells (24 hpi) and 2 independent experiments for each time point. Scale bars, 10 µm (b, f), 2 µm (c, g, k), 500 nm (d, e, h, i, j, l). Dashed lines in c and g indicate the boundary of the cell nucleus (large dark region). Localizations that belong to the same cluster in j, k, l are depicted with the same color, but colors are reused. Color bars in c–e, g–i show the number of single-molecule localizations within each SR pixel (20 × 20 nm2).

