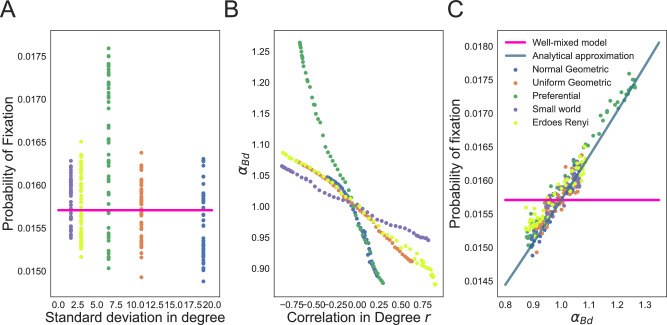
Fig. 4. Effects of the mixing pattern on the Bd probability of fixation.
The dots represent ensemble averages across 5 × 10⁶ replicate Monte Carlo simulations, while the lines represent our analytical approximations. Here the degree distribution is held constant as we vary the mixing pattern of the graphs, N = 100 and s = 0.1. Colors indicate the graph family (with the same degree distribution) as in the legend. Mixing pattern of the graph is tuned using edge swapping operations. To highlight that mean and variance in degree is not enough to predict probabilities of fixation, A shows that the probability of fixation can span a wide range of values, for the same mean and standard deviation in degree. B shows the dependence of the amplification parameter on the mixing pattern, or correlation in degree r. C shows that the selection amplification factor from Eq. (9) explains the effect of graph mixing pattern on the probability of fixation.

