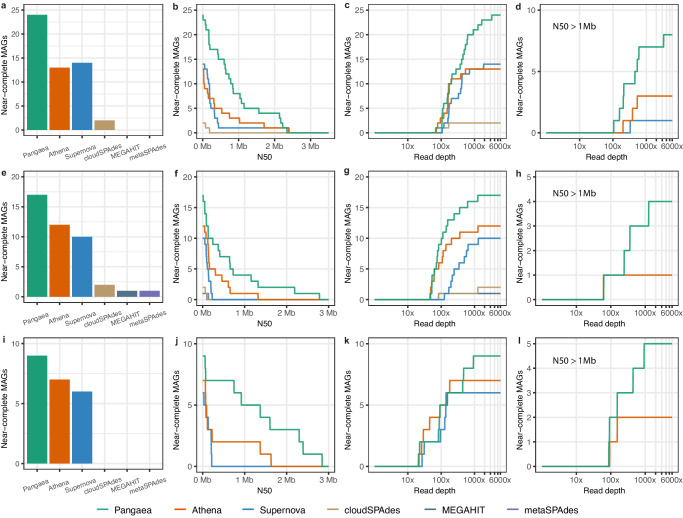
Fig. 3. The number of NCMAGs from the three human gut microbiomes under different N50s and read depths.
The number of NCMAGs for S1 (a), the number of NCMAGs by thresholding minimum N50 for S1 (b), the number of NCMAGs by thresholding maximum read depth for S1 (c), and the number of NCMAGs with N50 > 1Mb by thresholding maximum read depth for S1 (d). The number of NCMAGs for S2 (e), the number of NCMAGs by thresholding minimum N50 for S2 (f), the number of NCMAGs by thresholding maximum read depth for S2 (g), and the number of NCMAGs with N50 > 1Mb by thresholding maximum read depth for S2 (h). The number of NCMAGs for S3 (i), the number of NCMAGs by thresholding minimum N50 for S3 (j), the number of NCMAGs by thresholding maximum read depth for S3 (k), and the number of NCMAGs with N50 > 1Mb by thresholding maximum read depth for S3 (l). Source data are provided as a Source Data file.

