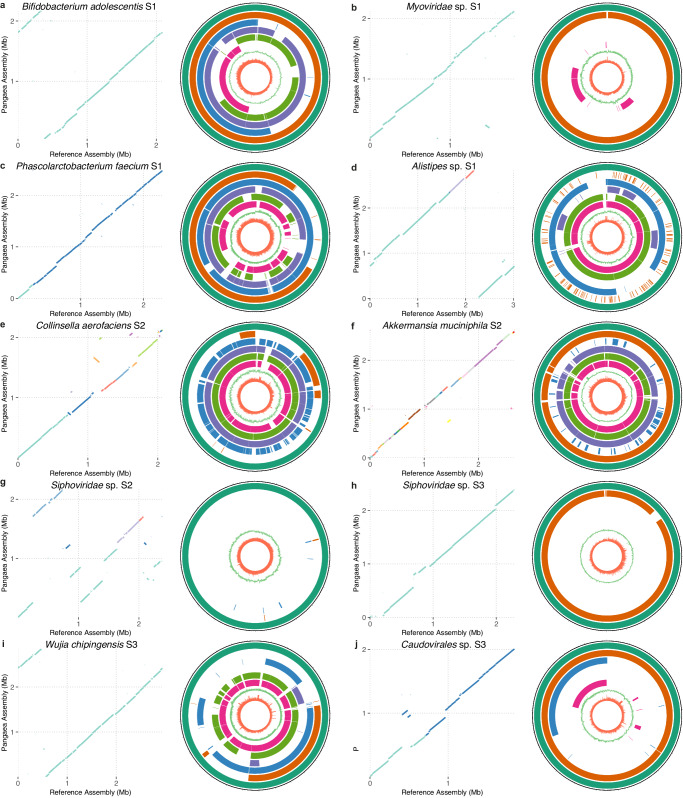
Fig. 5. Genome collinearity between the species-level NCMAGs produced by Pangaea and their closest reference genomes (dot plots), and comparison of different MAGs of the same species (circos plots).
a–d The selected NCMAGs of Pangaea for S1. e–g The selected NCMAGs of Pangaea for S2. h–j The selected NCMAGs of Pangaea for S3. Pangaea obtained complete and circular NCMAGs for (a, b, i). Concentric rings in the circos plots from outermost to innermost display Pangaea (dark green), Athena (orange), Supernova (blue), cloudSPAdes (purple), MEGAHIT (light green), metaSPAdes (pink), GC-skew, and read depth of Pangaea MAGs, respectively. Long tick marks on the outer black circle indicate 100 kb intervals. For species with multiple MAGs from the same assembler, only the MAG with the highest N50 is shown. The remaining species-level NCMAGs of Pangaea are shown in Supplementary Fig. 4. Source data are provided as a Source Data file.

