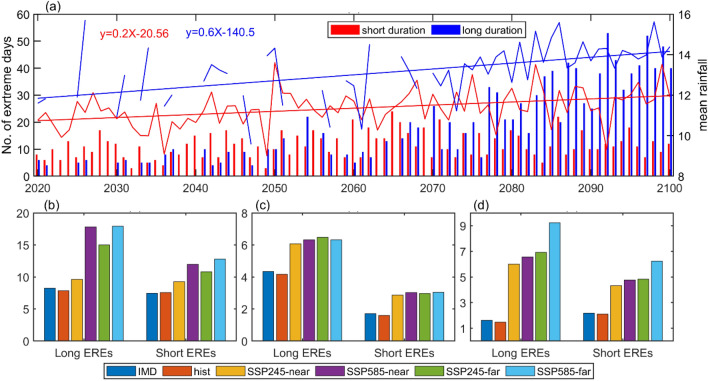
Figure 6.
(a) Number of short and long duration EREs over monsoon core region during JJAS season (bars) and associated mean rainfall over India (line) for high emission scenario (SSP5-8.5) of MMM-bc product. The equation in red and blue color represents the trend of short and long duration of EREs for the period 2020–2100, respectively. (b) Area (%) experiencing the twofold of rainfall exceeding the mean rainfall over India associated with the EREs for the base period. (c) duration of ERES over monsoon core region. (d) All India mean rainfall associated with the EREs over monsoon core region. (Figure created using the Matlab R2023a; https://in.mathworks.com/).

