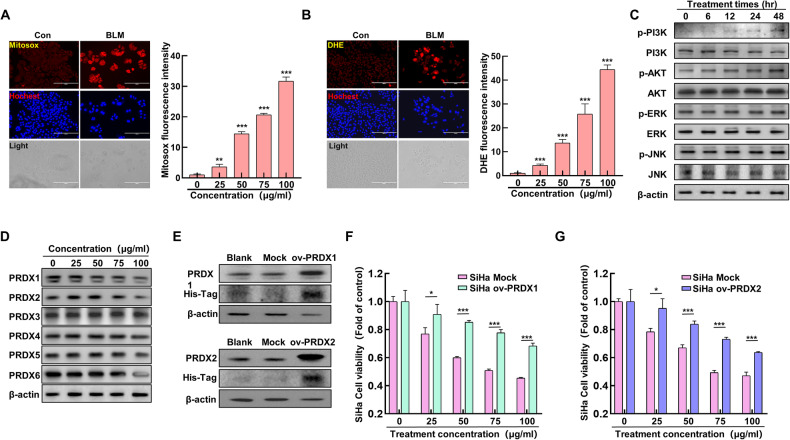
Fig. 2. Impact of peroxiredoxin I and II inhibition on bleomycin-induced ER stress.
A Mitosox staining to assess mitochondrial ROS in SiHa cervical cancer cells was treated with varying BLM concentrations (0, 25, 50, 75, 100 µg/mL); qualitative (left) and quantitative (right) analyses were performed using fluorescence microscopy. B DHE staining to quantify intracellular ROS levels at different BLM doses (0, 25, 50, 75, 100 µg/mL), analyzed qualitatively (left) and quantitatively (right) via fluorescence microscopy. C Western blot for PI3K/AKT and MAPK pathway proteins following BLM treatment over time (0, 6, 12, 24, 48 hours). D Western blot of PRDXs proteins post BLM treatment (0, 25, 50, 75, 100 µg/mL). E Construct SiHa cell lines overexpressing PRDX1 and PRDX2 and analyze the expression of PRDX1 and PRDX2 proteins using western blot. F Treat Mock and ov-PRDX1 SiHa cells with different concentrations of BLM (0, 25, 50, 75, 100 µg/mL), and analyze cell viability. G Treat Mock and ov-PRDX2 SiHa cells with different concentrations of BLM (0, 25, 50, 75, 100 µg/mL), and analyze cell viability. Significance indicated by **P < 0.01; ***P < 0.001.

