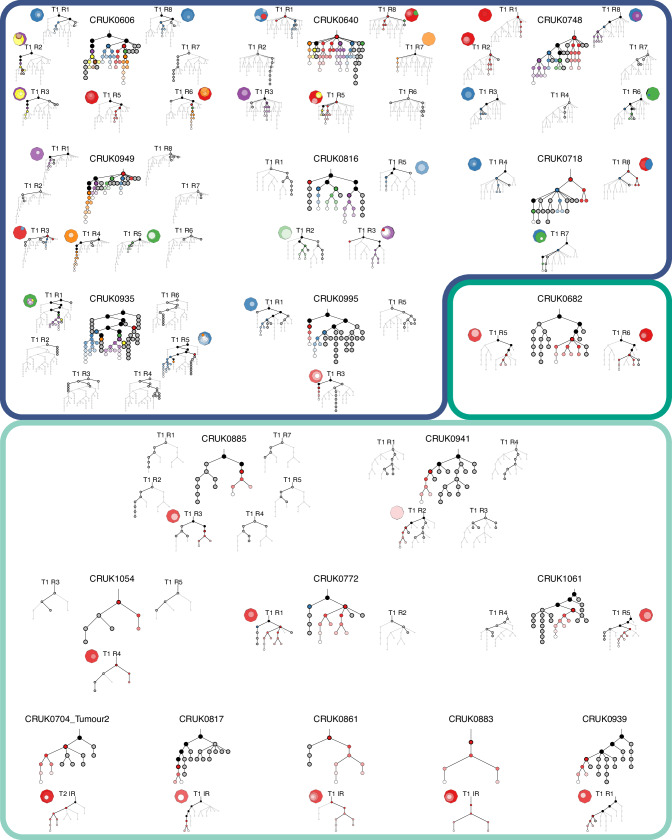
Fig. 5. Representation of multiple primary tumor subclones in multi-region PDX models.
An overview of phylogenetic trees (based on all primary tumor region and PDX data) and subclonal composition of the P0 PDX models is shown for each tumor that underwent whole-exome sequencing. Nine cases with multiple region-specific PDX models are shown (top). Eight of these cases have multiple primary tumor clones engrafting in the PDX models (blue border), while in one case both PDX models were engrafted by the same clone (green border). A further ten cases had a single PDX model per tumor which was engrafted by a single tumor clone (light green border, bottom). For each case, a phylogenetic tree constructed from primary tumor data and all PDX samples is shown in the center. Regional phylogenetic trees are shown for regions with attempted PDX engraftments highlighting clusters that were present in the primary tumor region of origin and/or the matched PDX model. Black - shared clusters between primary tumor (main tree), or primary tumor region of origin (regional trees) and PDX model; gray - primary tumor specific clusters (or primary tumor region specific); colors (red, blue, green, purple, orange) indicate independent engrafting clusters, and subsequent diversification in the PDX models is indicated by a gradient of each color (to white). Clusters highlighted with a bold black border were present (either detectable as clones or ancestral) in the primary tumor (main tree) or primary tumor region of origin (regional trees) while the other clusters are either PDX-specific or below the limit of detection in the primary tumor. Additionally, for each PDX model a clone map illustrates the clonal composition of the P0 PDX sample. T—tumor; R—region.

