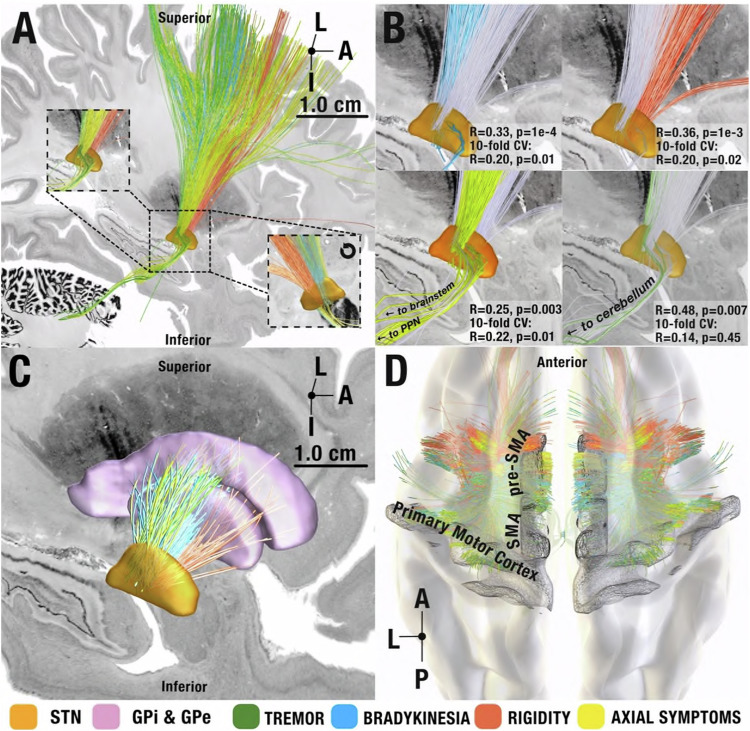
Fig. 2. Symptom-network library.
Views (A)–(C) from medial. A symptom-response tracts shown in sagittal view from medial and magnified at the level of the STN (orange, insets, one rotated by 180 degrees, i.e., shown from lateral view). Symptom-response tracts follow a rostrocaudal gradient with tremor most occipital, followed by bradykinesia, axial symptoms, and rigidity. All shown tracts significantly correlated with symptom improvements after correcting for multiple comparisons (α < 0.05) using a two-tailed correlation analysis test. Note that tracts are in proximity to one another, making it possible to modulate all of them with a single well-placed electrode (matching clinical experience). B Symptom-response tracts visualized separately at the STN level with the other tracts grayed out for spatial comparison. Insets represent circular and 10-fold cross-validation results for each symptom tract. C Segregation of symptoms within indirect pathway streamlines between STN and pallidum, following a similar rostrocaudal gradient. D Cortical origins of hyperdirect projections. Streamlines associated with tremor improvements originated in primary motor cortex, whereas the ones associated with improvements in hypokinetic symptoms originated from premotor regions in a more interspersed fashion. I = Inferior, A = Anterior, L = Lateral, P = Posterior.

