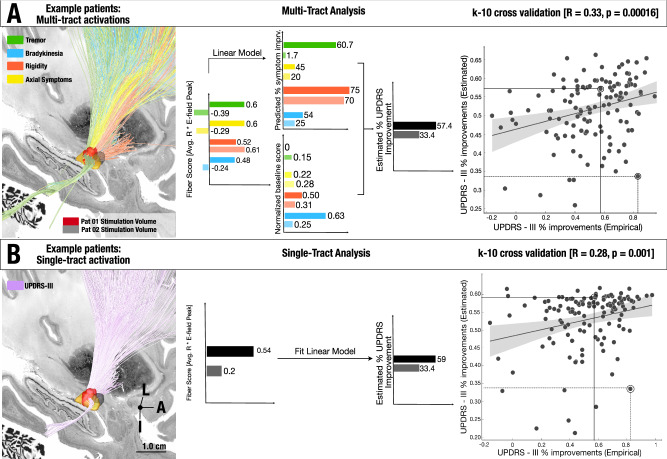
Fig. 4. Network Blending.
A Two example patients’ stimulation volumes are shown alongside the optimal streamlines associated with symptom-response tracts. These two patient examples illustrate both extremes of the model estimation: one, where the absolute error value of model estimate is low and the other, where the absolute error is higher. To derive group level statistics, we employ the multi tract model across the four symptoms, and this process led to four scores, each coding for one symptom. These were linearly weighted by the symptoms prevalent in each patient (since, for instance, a patient with severe tremor would profit more from modulating the tremor streamlines) and averaged, leading to a weighted-average score that was converted to UPDRS-III improvements based on the training data. These estimated improvements significantly correlated with actual improvements when analyzed via a two-tailed correlation analysis (R = 0.33 p = 0.00016, mean absolute error: 17.87%, RMSE: 0.22, R2 = 0.08). B Stimulation volume of the same two patients shown alongside the optimal streamlines associated with global UPDRS-III improvements. These fiber scores (0.54, 0.20) were transformed to estimated values of global UPDRS-III improvements based on the training data within the 10-fold cross-validation process. These estimated improvements significantly correlated with empirical improvements, when analyzed through a two-tailed correlation analysis (R = 0.28, p = 0.01, mean absolute error: 18.11%, RMSE = 0.22, R2 = 0.05). The shaded area in the correlation plot signifies the 95% confidence interval on the slope of the line. L = Lateral, A = Anterior, I = Inferior. Source data available as source data file.

