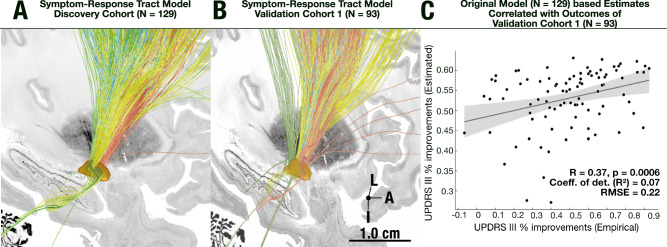
Fig. 5. Retrospective validation on long-term clinical outcome data.
A The fiber distribution of the original model as shown in previous figures, B fiber distribution when recalculating the same model on the independent test dataset (N = 93). C Estimation of UPDRS-III improvements in the test set (R = 0.37, p = 0.0006, R2 = 0.07, RMSE = 0.22, MAE = 17.16), based on the original symptom response model, using two-tailed correlation analysis. The shaded area of the correlation plot signifies 95% confidence interval on the slope of the line. L = Lateral, A = Anterior, I = Inferior. Source data available as source data file.

