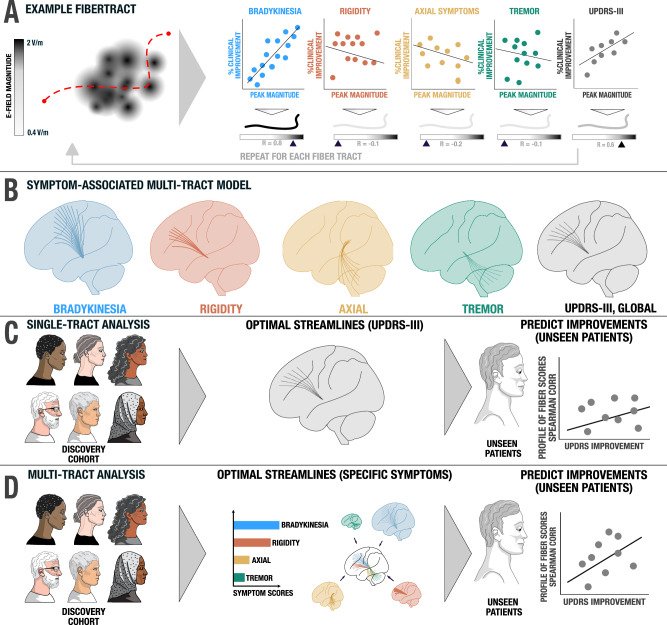
Fig. 8. Methods for calculating and cross-validating the multi-tract model / symptom network library.
A An example fiber tract from the pathway atlas is shown (red dashed line). For each E-field that it passes, the peak magnitude is recorded and correlated with symptom improvements. For instance, the example tract was strongly activated by E-fields that led to improvements in bradykinesia (blue scatter plot), leading to general UPDRS-III improvement (gray scatter plot). The tract is tagged by five Spearman rank correlation coefficients, one for each symptom domain, and one for global motor improvement. B This process is repeated across all fiber tracts in the pathway atlas to create the symptom network library. Tracts can be filtered and visualized based on the correlation coefficients (and significance values) they obtained. C The single tract model (coding for global motor improvements) is cross-validated by estimating motor improvements in left-out patients based on their activation of the tract. D A more elaborate symptom-specific tract model repeats this procedure four times (for each symptom tract) and weight estimates by baseline scores of each symptom.

