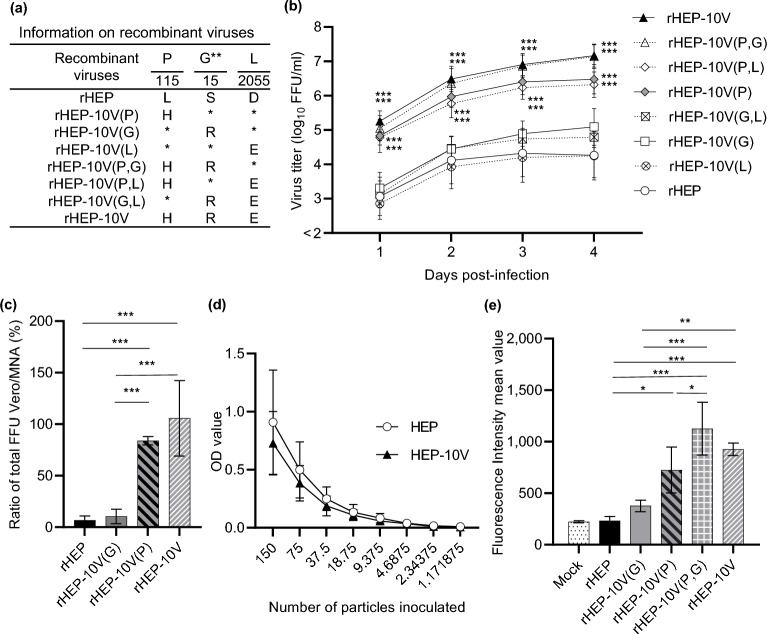
Figure 6.
Efficiency of viral growth, entry, and expression of G protein of each recombinant viruses in Vero cells. (a) Information on recombinant viruses used in this figure. *: Amino acid sequence identical with rHEP. **: Amino acid positions are numbered based on the mature G protein without signal peptide. (b) Vero cells were inoculated with the indicated recombinant viruses (a) at a M.O.I. of 0.05 and supernatants were collected every day until 4 d.p.i. Viral titers were determined in MNA cells. (c) The total number of focuses was determined by counting the number of focuses stained with the FITC anti-rabies monoclonal globulin in Vero or MNA cells under a fluorescence microscope. The ratio of the number of focuses in Vero to that in MNA was compared. (d) The particle titer of each secreted alkaline phosphatase (SEAP)-expressing VSVp stock was determined in MNA cells. Vero cells then were inoculated with two-fold serial dilutions (starting from 150 particles) of VSVp pseudotyped with the HEP or HEP-10V G protein SEAP activity was assessed in culture supernatants and detected by optical density (OD). (e) Vero cells were inoculated with each recombinant virus at an M.O.I. of 5 and harvested at 2 d.p.i. The cells were stained with anti-rabies G protein monoclonal antibody (#7-1-9) and FITC-conjugated anti-mouse secondary. After that, cells were fixed with 4% paraformaldehyde, and finally analyzed by BD FACS Canto II flow cytometer (Becton Dickinson and Company; BD, Franklin Lakes, NJ, USA) and Kaluza analysis software Version 2.1 (Beckman Coulter Life Sciences, Indianapolis, IN, USA). Data are presented as the mean and S.D. from three (b, d, e) or four (c) independent experiments. Significant differences are indicated in the comparison between rHEP and each recombinant virus after application of two-way ANOVA followed by Tukey (b), or each virus after application of one-way ANOVA followed by Turkey (c, e) or two-way ANOVA followed by Sidaks (d) (*: p < 0.05, **: p < 0.01, ***: p < 0.001).

