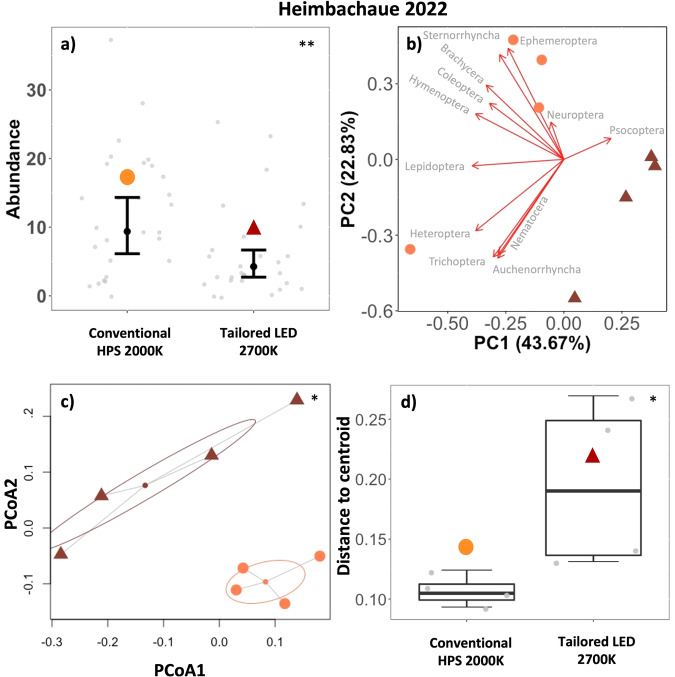
Fig. 5. Rural municipal site, rural, Heimbachaue, Betzweiler.
a Total number of individuals per road light and night (Abundance, gray points) in different treatments (symbols). n = 7 samplings × 4 luminaires per treatment, transition from conventional luminaires (HPS 2000K) to tailored and shielded luminaires (LED 2700 K). Predictions (black points) and 95% confidence intervals (error bars) based on a generalized linear regression model (p = 0.005**) b PCA Principal component analysis of multiple luminaires (n = 4) grouped by treatment (symbols). Arrows depict loadings of individual insect taxa. c PERMANOVA Permutational Multivariate Analysis of Variances (df = 1, R2 = 0.390, F = 3.844, p = 0.025 *) of multiple luminaires grouped by treatment (symbols). Ellipses based on SD. d Within group dispersion (community dispersion) of luminaires in the same treatment. Distances to centroids (gray points). Boxplots show median (thick line), interquartile range (IQR) (box), outliers (black points), 1.5 x IQR (whiskers), ANOVA (p = 0.049*).

