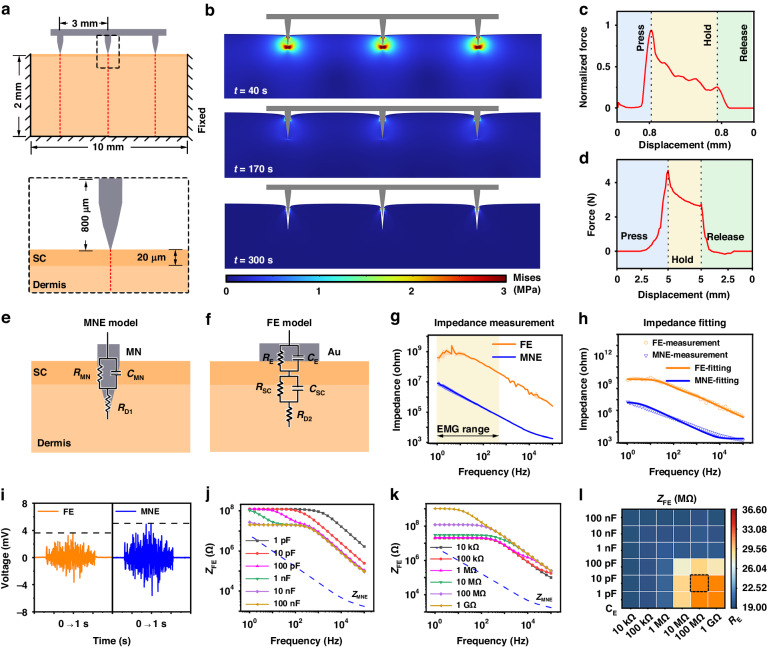
Fig. 3. Mechanical and electrical simulation analysis of electrode–skin models.
a Finite element models of microneedle penetration-retraction in skin. b Thermogram of the stress distribution in the skin during insertion and removal of the microneedle. c A plot of the reaction force versus loading displacement for the insertion and removal of microneedles was obtained through COMSOL simulations. d A plot of reaction forces versus loaded displacements was obtained by inserting and removing the MMA during actual mechanical testing. e Schematic diagram of the MNE-skin equivalent circuit model. f Schematic diagram of the FE-skin equivalent circuit model. g FE/MNE-skin impedance measurements. h Impedance fitting curves for MNEs versus FEs on the skin. i Electrical simulations were performed using typical EMG signals to obtain the EMG signals acquired by the MNE and FE models. The blue line represents the EMG signal detected by the MNE, while the orange line represents the EMG signal detected by the FE. j The of the FE model was obtained by varying the value of while was set at 100 MΩ. k The of the FE model was obtained by varying the value of while was set at 10 pF. l The heatmap summarizing the calculations conducted at a frequency of 100 Hz across varying and values

