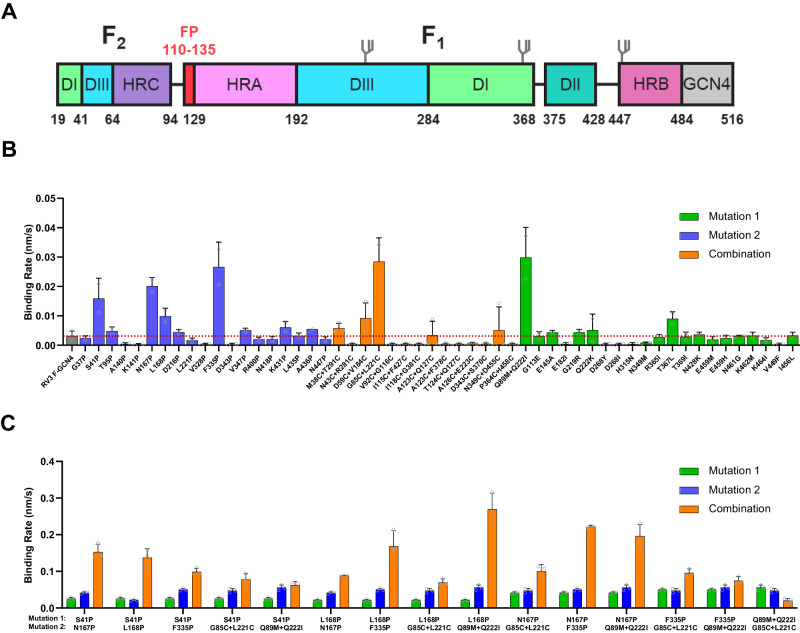
Fig. 1. Identification of RV3 preF-stabilizing substitutions.
A Schematic of the RV3 F ectodomain used to screen for stabilizing substitutions in the head domain. The domain organization is color-coded, with start and end residue numbers indicated. Location of N-linked glycosylation sites are shown. B, C Expression of preF protein variants in supernatant as measured by BioLayer Interferometry (BLI) using immobilized PIA174. The initial slope, V0, at the start of binding is plotted as the average of three independent transfections; shown is the mean with error bars representing the standard deviation (SD). B Individual substitutions were tested and are colored by design feature. The dotted red line indicates the binding rate of the backbone construct RV3 F-GCN4. C Combinations (orange) of promising stabilizing substitutions of (B) were tested and compared to the individual substitutions (green and blue).

