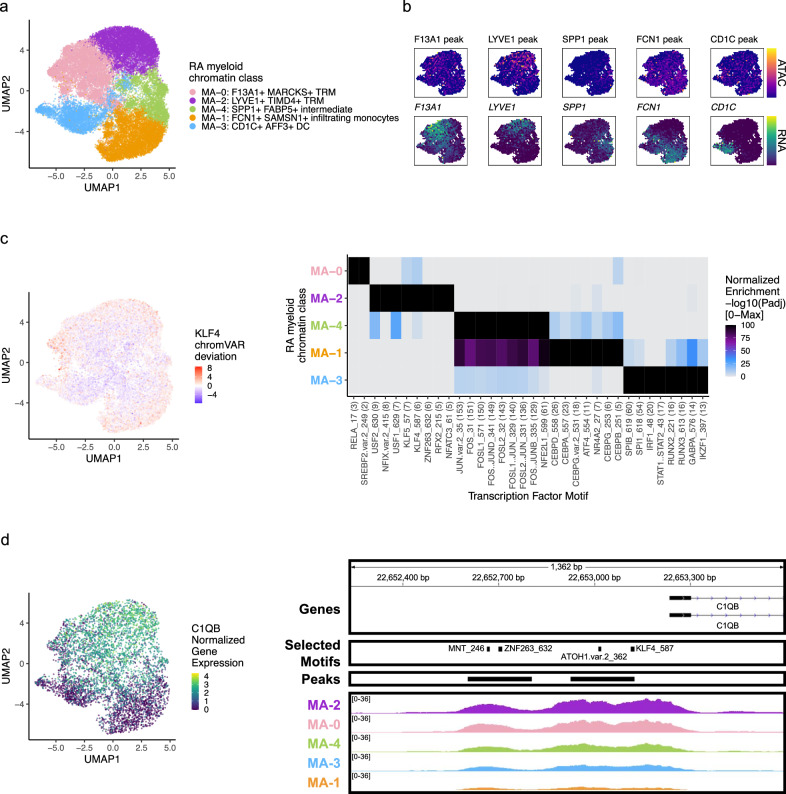
Fig. 4. RA myeloid chromatin classes.
a UMAP colored by 5 myeloid chromatin classes defined from unimodal scATAC-seq and multimodal snATAC-seq cells. b Mean binned normalized marker peak accessibility (top; yellow (high) to purple (low)) and gene expression (bottom; yellow (high) to blue (low)) for multimodal snATAC-seq cells on UMAP. c UMAP colored by chromVAR34 deviations for the KLF4 motif (left). Most significantly enriched motifs in class-specific peaks per myeloid chromatin class (right). To be included per class, motifs had to be enriched in the class above a minimal threshold, and corresponding TFs had to have at least minimal expression in snRNA-seq. Color scale normalized per motif across classes with max −log10(padj) value shown in parentheses in motif label. P values were calculated via hypergeometric test in ArchR35. d UMAP colored by C1QB normalized gene expression (left). C1QB locus (chr1: 22,652,235–22,653,595) with selected gene isoforms, motifs, open chromatin peaks, and chromatin accessibility reads from unimodal and multiome cells aggregated by chromatin class and scaled by read counts per class (right).

