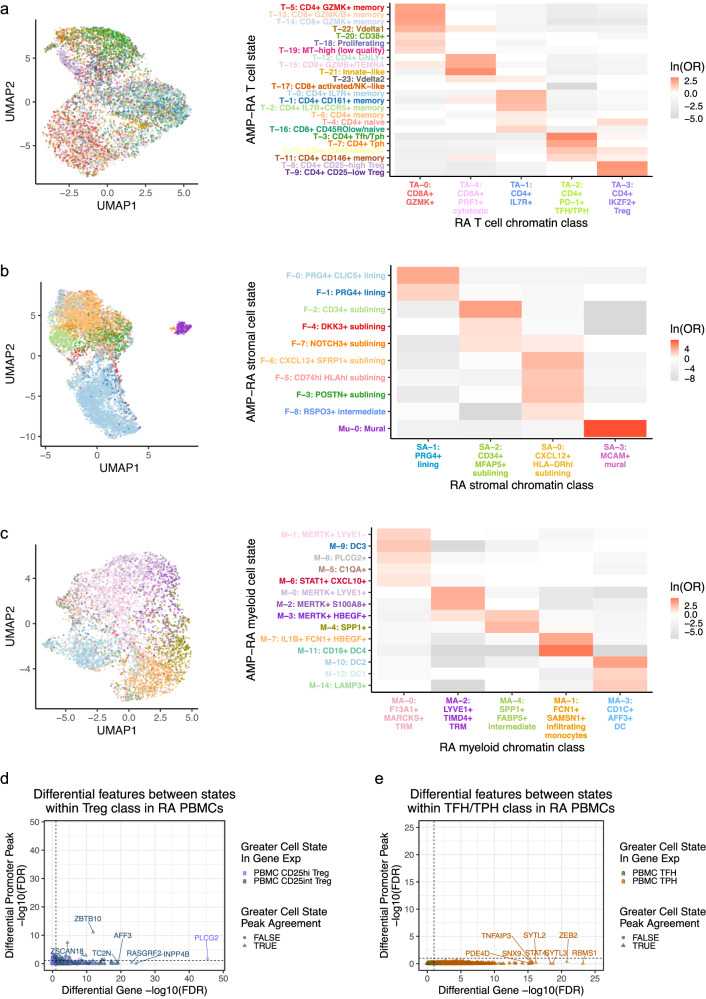
Fig. 7. A chromatin class encompassed multiple transcriptional cell states in proposed superstate model.
a–c For a T, b stromal, and c myeloid cells, chromatin class UMAP colored by the classified AMP-RA reference transcriptional cell states for multiome cells (left) and the natural log of the odds ratio between the chromatin classes and transcriptional cell states (right). On the right, non-significant values (FDR < 0.05) are white, and the colors of the y axis labels correspond to the colors in the UMAPs on the left. In c, the M-13: pDC transcriptional cell state was excluded as fewer than 10 cells were classified into it. d, e Using genes and promoter peak pairs with at least minimal signal, the two-sided Wilcoxon −log10(FDR) of normalized gene expression (x axis) and the logistic regression LRT −log10(FDR) of binary promoter peak accessibility (y axis) between d RA PBMC CD25hi and CD25int Treg populations (n = 7208 pairs) and e RA PBMC TFH and TPH populations (n = 5264 pairs). Color was determined by the state with the higher gene expression and the shape denotes whether the state with the higher chromatin accessibility agreed. The dotted lines correspond to FDR = 0.10, calculated separately within modalities.

