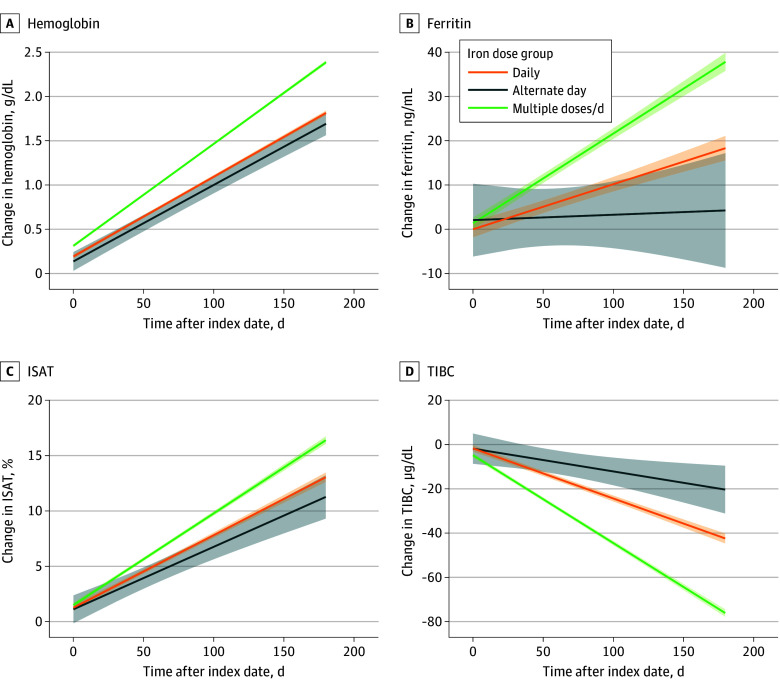
Figure 2. Estimated Change in Hemoglobin and Iron Indices in Cohort With Normal Kidney Function.
Figure shows the mean rates of change in hemoglobin (A), ferritin (B), ISAT (C), and TIBC (D) among patients with iron deficiency anemia and normal kidney function in each dose group up to 180 days postindex date. Lines represent estimates from linear mixed-effects models, and the shaded regions represent 95% CIs. Plots correspond to models without added covariates for adjustment because these did not affect estimates in a meaningful manner. To convert ferritin to micrograms per liter, multiply by 1; hemoglobin to grams per liter, multiply by 10; TIBC to micromoles per liter, multiply by 0.179. ISAT indicates iron saturation; TIBC, total iron binding capacity.

