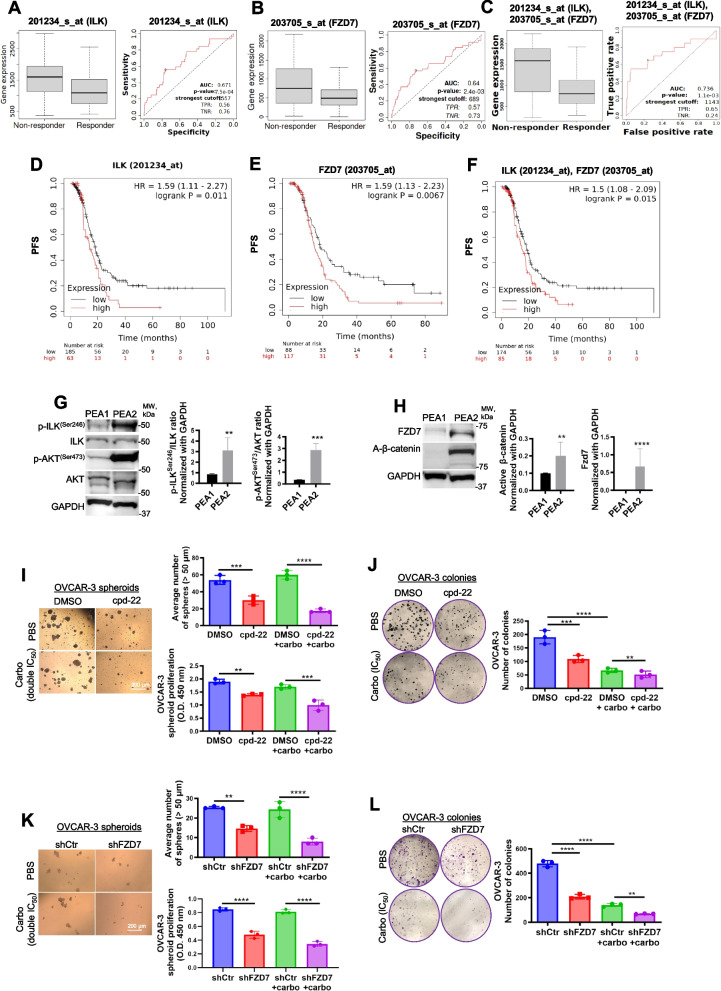
Fig. 5.
Fzd7-KD and ILK inhibition sensitize to platinum treatment. A-C Boxplot and ROC curve of ILK (A), Fzd7 (B), and ILK-Fzd7 combination (C) involved in platinum resistance using the RFS at 6 months cohort from the ROC plotter for OC (Affymetrix ID: 201234_s_at (ILK) and 203705_s_at (Fzd7), respectively). ROC curve analysis shows the sensitivity and specificity of ILK and Fzd7 in predicting the patient response to treatment (P = 7.5e-04, P = 2.4e-03, and P = 1.1e-03, respectively). D-F PFS curves for ILK (D), Fzd7 (E), and ILK in combination with Fzd7 (F) mRNA expression in HGSOC patients (stage: 3 + 4, grade: 3) following platinum/taxane therapy generated using the KM plotter (HR = 1.59, P = 0.011; HR = 1.59, P = 0.0067; and HR = 1.5, P = 0.015, respectively). G WB for p-ILKSer246, ILK, p-AKTSer473, AKT, and GAPDH in HGSOC platinum (S) PEA1 and platinum (R) PEA2 cells (left panel). Densitometry quantifies p-ILKSer246/ILK and p-AKTSer473/AKT ratio (right panel) (N = 3; **P < 0.01 and ***P < 0.001). H WB for A-β-catenin, Fzd7, and GAPDH in PEA1 and PEA2 cells (left panel). Densitometry quantifies A-β-catenin and Fzd7 expression levels (right panel) (N = 3; **P < 0.01 and ****P < 0.0001). I Representative phase contrast images of OVCAR-3 cells growing as spheroids and treated with DMSO, carboplatin (double IC50), cpd-22 (0.5 μM) or combination (right panel). Average number of spheroid count (> 50 μm in diameter) (upper-left panel) and CCK-8 quantification (lower-left panel) (N = 3; **P < 0.01, ***P < 0.001, ****P < 0.0001). J Clonogenic assay of OVCAR-3 cells treated with DMSO, carboplatin (IC50), cpd-22 (0.5 μM) or combination. Representative images of single-cell clone proliferation, stained with crystal violet (left panel) and quantification (right panel) (N = 3; **P < 0.01, ***P < 0.001, ****P < 0.0001). K Representative phase contrast images of shCtr vs shFzd7 (clone #2) OVCAR-3 cells growing as spheroids and treated with carboplatin (double IC50) (left panel). Average number of spheroid count (> 50 μm in diameter) (upper-right panel) and CCK-8 quantification (lower-right panel) (N = 3; **P < 0.01 and ****P < 0.0001). L Clonogenic assay of shCtr vs shFzd7 (clone #2) OVCAR-3 cells treated with carboplatin (IC50). Representative images of single-cell clone proliferation, stained with crystal violet (left panel) and quantification (right panel) (N = 3; **P < 0.01 and ****P < 0.0001)

