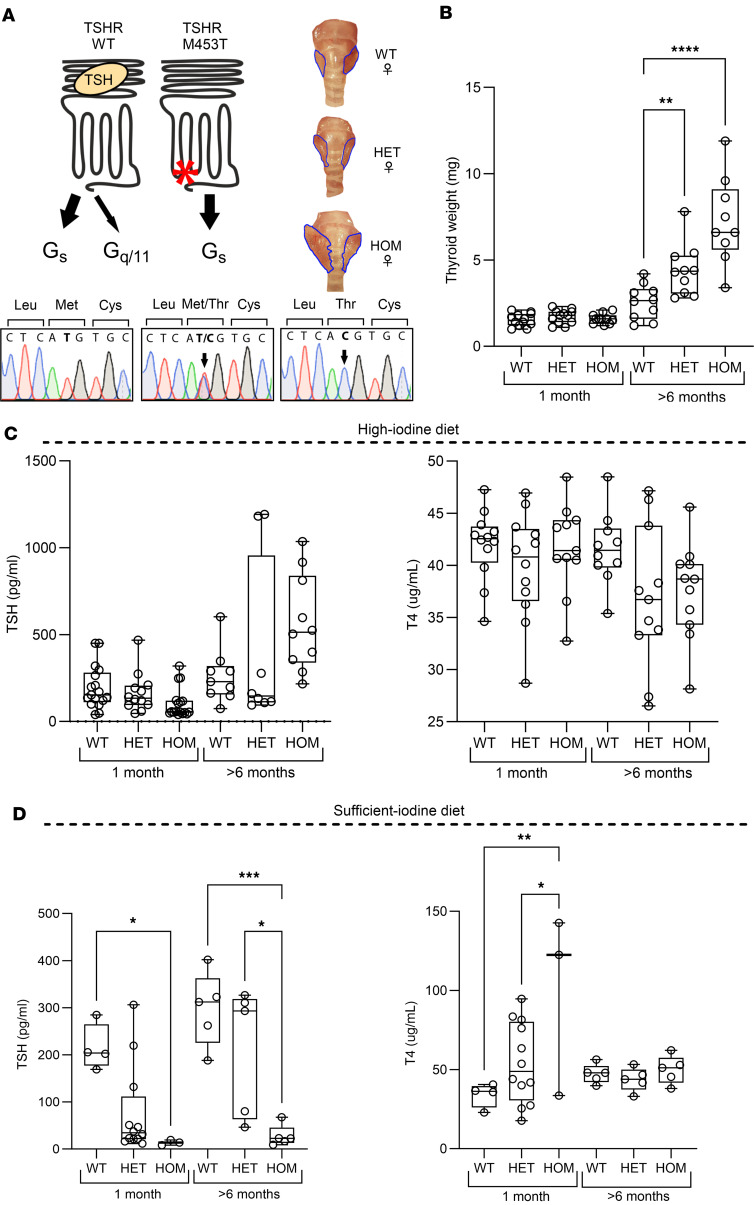
Figure 4. Generation and characterization of the thyroid phenotype in knockin mice carrying a constitutively active TSHR M453T mutation.
(A) Illustration of the location of TSHR M453T mutation and its G protein signaling preferences compared with WT TSHR. Below is a representative genotyping chromatogram of WT, heterozygous (HET), and homozygous (HOM) TSHR M453T mice, from left to right. The generation of the model using CRISPR/Cas9 and homology-directed repair technique, genomic location, and designed guide RNA (gRNA) construct and genotyping protocol is described in Supplemental Figure 7. On the right, representative thyroid images of WT, HET, and HOM TSHR female mice. (B–D) Thyroid weight (B) and serum TSH and T4 concentrations of 1 and >6-month-old WT, HET, and HOM TSHR mutant mice under high-iodine (C) and sufficient-iodine (D) diets. n = 3–17 male and female mice per genotype. Box-and-whisker plot represents median, 25th, and 75th percentile, with whiskers from minimum to maximum with all points shown. Statistical analysis was carried out using the 1-way ANOVA with Bonferroni’s multiple-comparisons test. *P < 0.05; **P < 0.01; ***P < 0.001; ****P < 0.0001.

