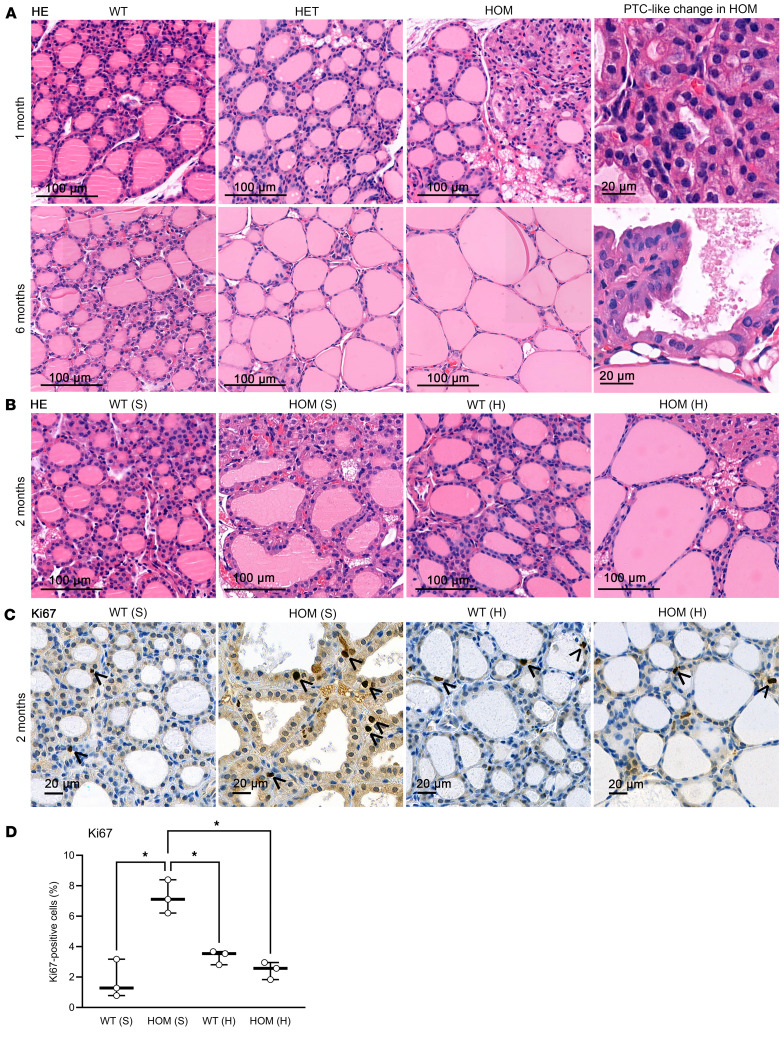
Figure 6. Thyroid histology of knockin mice carrying a constitutively active TSHR M453T mutation.
(A) Representative H&E-stained thyroid images of WT, heterozygous (HET), and homozygous (HOM) female mice at 1 and 6 months of age. Scale bars: 100 μm. On the right, 2 magnifications of papillary thyroid carcinoma–like areas in HOM thyroid. Scale bars: 20 μm. (B) Representative H&E-stained images of thyroid tissue of WT and HOM mice after 2 months sufficient-iodine (S) or high-iodine (H) diets. Scale bars: 100 μm. (C) Ki67 IHC of thyroid sections of WT and HOM female mice, born and maintained under S or H diet for 2 months. Scale bars: 20 μm. Arrowheads indicate Ki67-stained nuclei. (D) The number of Ki67+ cells relative to the total number of thyrocytes of 2-month-old female WT and HOM mice that uphold their lifetime with S or H diets (n = 3–5 mice/group). Box-and-whisker plot with median, 25th and 75th percentiles shown with box, and minimum to maximum with whiskers. Individual samples shown as circles. Brown-Forsythe and Welch 1-way ANOVA tests with Dunn’s multiple comparison. *P < 0.05.

