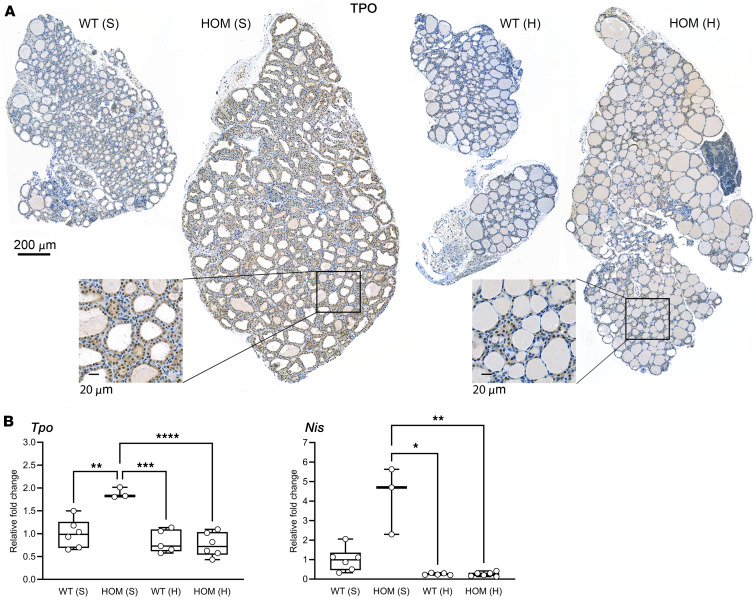
Figure 7. Tpo and Nis expression in thyroids of WT and TSHR M453T HOM mice after 2 months of S and H diets.
(A) Representative TPO IHC data. Scale bars: 200 μm and 20 μm (insets). (B) Relative gene expression of Tpo and Nis in thyroids, quantified by qPCR. The data are presented as fold change in HOM S (n = 3), WT H (n = 5), and HOM H (n = 6) relative to WT S (n = 6) as the calibrator. Expressed as mean ± SD; statistical significance for Tpo (1-way ANOVA, Tukey’s test) and for Nis (Kruskal-Wallis, Dunn’s test). *P < 0.05, **P < 0.01, ***P < 0.001, ****P < 0.0001. Boxes show median, 25th and 75th percentiles; whiskers show minimum to maximum.

