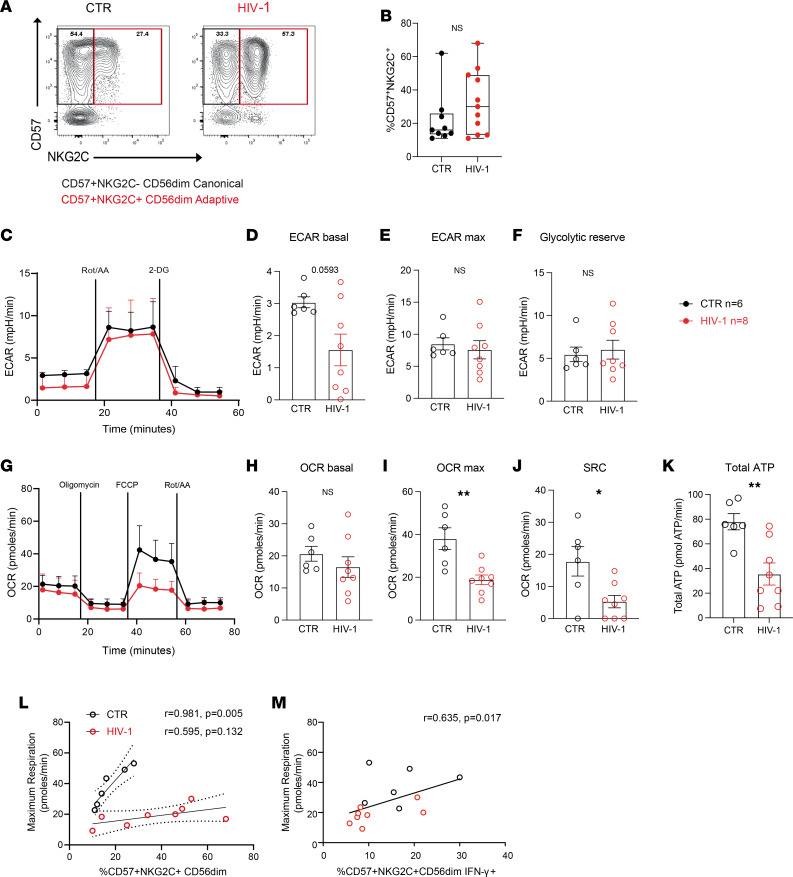
Figure 1. Analysis of the basal metabolic profile of NK cells in control (CTR) and HIV-1+ donors.
(A) Representative example of flow cytometry plots showing canonical (NKG2C–CD57+) and adaptive (NKG2C+CD57+) NK cell subsets. (B) Summary data showing the frequencies of adaptive NK cells (CD56dimCD57+NKG2C+) in HIV-1– (CTR) and HIV-1+ (HIV) donors. (C) Real-time analysis of aerobic glycolysis (determined from the extracellular acidification rate [ECAR]) in purified NK cells. (D–F) basal ECAR, maximal ECAR, and glycolytic reserve in isolated NK cells from n = 6 HCMV+ HIV-1– CTR and n = 8 patients positive for HIV-1. (G) Real-time analysis of oxygen consumption rate (OCR) in isolated NK cells from both study groups. (H–J) Basal OCR, maximal OCR (OCR max), and spare respiratory capacity (SRC). Data are shown as mean ± SEM. (K) Summary of the total rate of ATP production by NK cells in CTR and HIV-1+ donors. (L and M) Correlation between maximal OCR and ex vivo percentage of adaptive CD57+NKG2C+CD56dim NK cells (L) and proportion of CD57+NKG2C+CD56dimIFN-γ+ cells after CD16 triggering (M). The nonparametric Spearman test was used for correlation analysis. Sample triplicates were used for Seahorse assays. Significance determined by 2-tailed Mann-Whitney U test; *P < 0.05, **P < 0.01.

