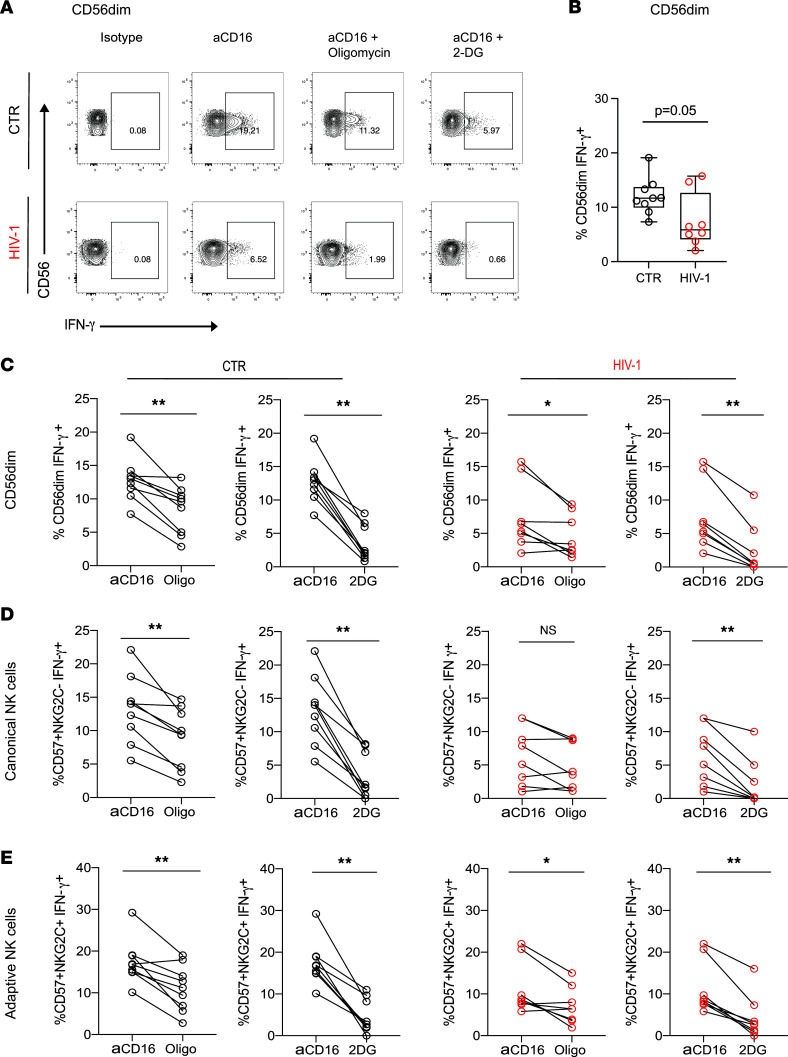
Figure 2. Metabolic requirements of NK cells for IFN-γ production after CD16 activation.
(A) Representative flow plots illustrating IFN-γ production by CD56dim NK cells from a HCMV+HIV-1– control (CTR) and HIV-1+ donor when stimulated with plate-bound anti-CD16 antibody alone or in the presence of oligomycin or 2-DG as indicated. (B) Summary analysis of IFN-γ production by CD56dim NK cells following anti-CD16 stimulation from n = 9 HCMV+HIV-1– CTR (black circles) and n = 8 patients with chronic HIV-1 (red circles). (C–E) Paired data showing IFN-γ production from CD56dim, canonical, and adaptive NK cells following anti-CD16 stimulation alone or in the presence of oligomycin or 2-DG in CTR donors (black circles) and HIV-1+ donors (red circles). Significance determined by 2-tailed Mann-Whitney U test or Wilcoxon matched-pairs signed-rank test;*P < 0.05, **P < 0.01.

