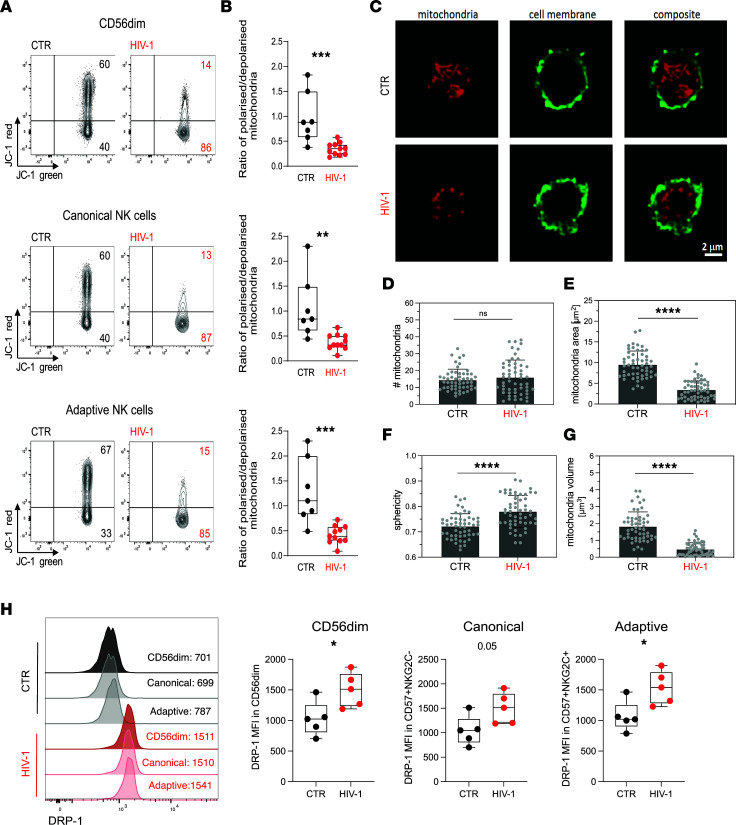
Figure 3. Evaluation of NK cell mitochondrial health.
(A and B) Representative flow plots (A) and box-and-whisker plots (B) depicting the ratio of polarized over depolarized mitochondrial (mitochondrial membrane potential [ΔΨm]) of total CD56dim NK cells and NK cell subsets by JC-1 staining in HCMV+HIV-1– controls (CTR, n = 7) and HIV-1+ patients (HIV-1, n = 11). JC-1 red staining designates polarized mitochondria, while loss of JC-1 red shows depolarization. The box-and-whisker plots show the median, quartiles, and range. (C) Representative confocal images of mitochondria (red) from purified NK cells from an HIV– CTR and an HIV-1+ donor. The NK cell membrane was visualized by staining with wheat germ agglutinin (green). Scale bar: 2 μm. (D–G) Quantification of mitochondria numbers, area, sphericity, and volume in purified NK cells from n = 3 CTR and n = 3 HIV-1+ donors. Each symbol represents the mean value of 1 cell. Data are from a minimum of 50 cells from 3 independent donors. (H) Representative histograms and summary data of DRP-1 expression levels in CD56dim, canonical (NKG2C–CD57+), and adaptive (NKG2C+CD57+) NK cells (CTR, n = 5; HIV-1, n = 5). Significance was determined by 2-tailed Mann-Whitney U test or 1-way ANOVA with Tukey’s post-hoc test; *P < 0.05, **P < 0.01, ***P < 0.001, ****P < 0.0001.

