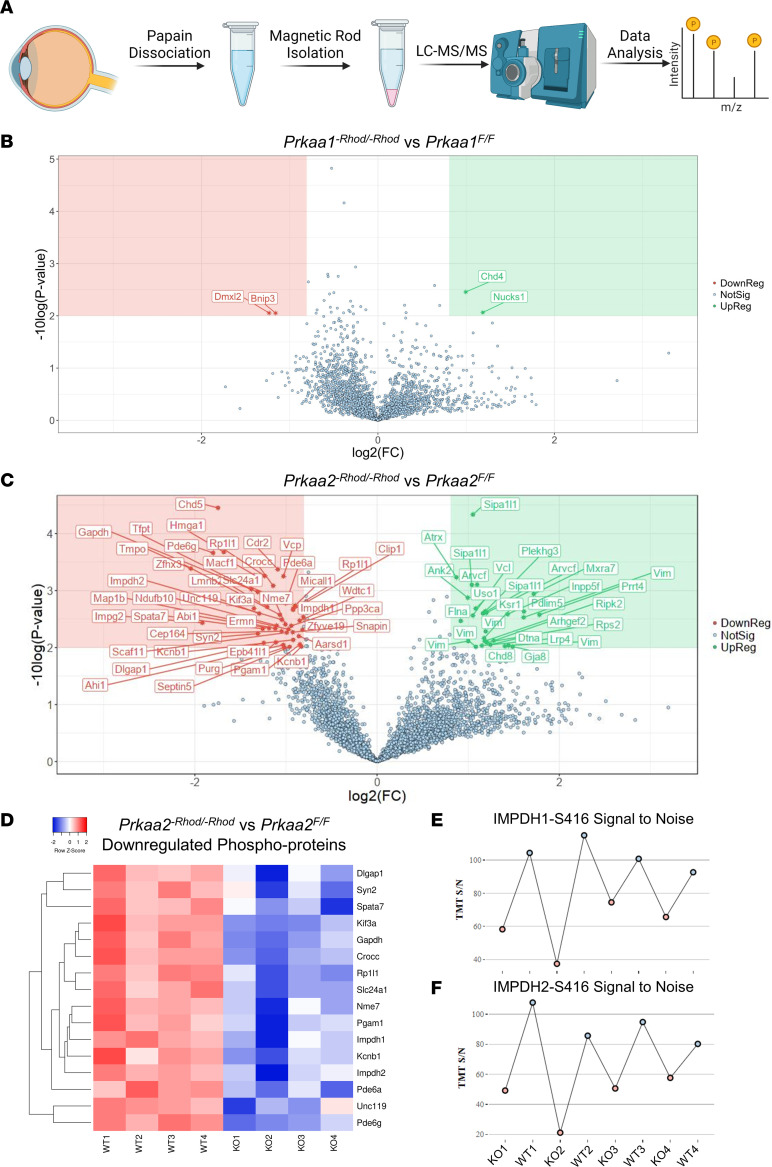
Figure 4. PRKAA2 dysfunction leads to wide changes to the phosphoproteome and decreased S416 phosphorylation of IMPDH.
(A) Schematic representation of the workflow to isolate rod photoreceptors to use for phosphoproteomics analysis. Six retinas were dissected per sample and first dissociated using papain digestion. CD73-PE and Rhodopsin-biotin antibodies were used to tag rod photoreceptor inner and outer segments and were isolated using immunomagnetic beads. The cells were then lysed and processed by LC-MS/MS using an unbiased phosphoproteomics pipeline and analyzed. (B and C) Rod photoreceptors from Prkaa1-Rhod/-Rhod and Prkaa2-Rhod/-Rhod were processed for phosphoproteomic analyses (n = 4). 1.75 fold-change and 0.01 P value cutoffs with < 1% false discovery rate were used to determine significant changes. (B) Prkaa1-Rhod/-Rhod analysis revealed 2 downregulated targets, which were unrelated to rod photoreceptor function. (C) Prkaa2-Rhod/-Rhod analysis revealed 45 downregulated targets, including species related to the phototransduction cascade and photoreceptor function. (D) A selection of downregulated phosphoproteins from the Prkaa2-Rhod/-Rhod phosphoproteomics data set were plotted on a heatmap to visualize the spread of individual samples. Samples with higher z scores are visualized as a deeper red color while samples with lower z scores are visualized as a deeper blue color. Each row represents a phospho-site of the denoted protein, while each column represents either a sample from Prkaa2fl/fl (WT) or Prkaa2-Rhod/-Rhod (KO). (E and F) Tandem mass tag (TMT) signal-to-noise ratios of IMPDH1-S416 and IMPDH2-S416 from individual Prkaa2fl/fl (WT) and Prkaa2-Rhod/-Rhod (KO) samples. KO samples are colored as pink dots while WT samples are colored as blue dots. In both IMPDH1-S416 and IMPDH2-S416 measurements, the KO samples overall present lower signal-to-noise ratios than WT samples.

