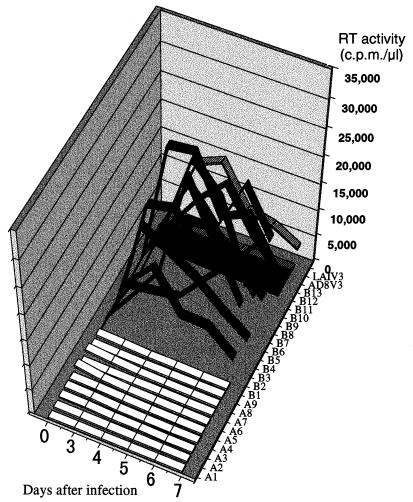
FIG. 3.
Replication kinetics of recombinant viruses in the MT2 cell line. Virus stocks used to infect cells were generated by transfecting HeLa cells with each sample of recombinant plasmid DNA. MT2 cells were infected with supernatant containing equal amounts of RT activity, and progeny virus production was monitored by measuring the RT activity released into the culture medium at the indicated time points. The RT activity of each recombinant virus at each time point is represented in the three-dimensional graph by white (viruses encoding group 1 V3), black (viruses encoding group 2 V3), and hatched (controls) bands.

