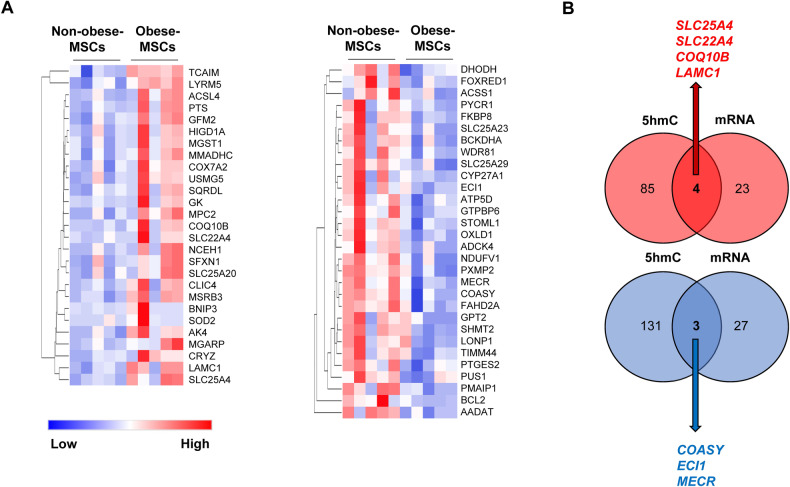
Fig. 2. mRNA-seq and integrated hMeDIP-seq/mRNA-seq analysis.
A Heat maps of mitochondria-associated genes upregulated (left) or downregulated (right) in Obese-MSCs compared to Non-obese-MSCs (n = 5 each). B Venn diagrams showing 4 genes (SLC25A4, SLC22A4, COQ10B, and LAMC1) with hyper-hydroxymethylated peaks that were upregulated (red) and 3 genes (COASY, ECI1, and MECR) with hypo-hydroxymethylated peaks that were downregulated (blue) in Obese-MSCs versus Non-obese-MSCs (n = 5 each).

