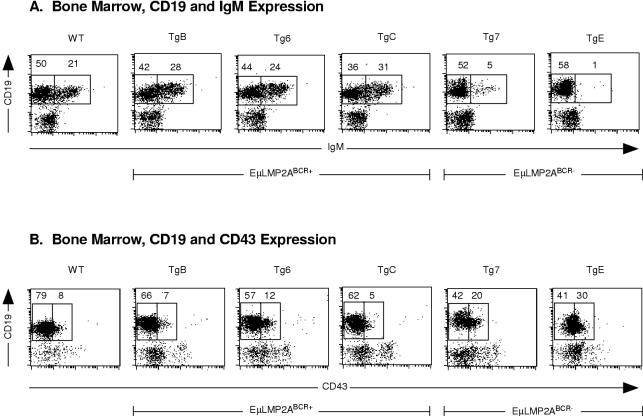
FIG. 4.
Flow cytometry analysis of EμLMP2A bone marrow. Single cell suspensions from all EμLMP2A bone marrow samples were prepared and stained with CD19, IgM, and CD43 antibodies for flow cytometry. EμLMP2A genotypes are indicated. (A) CD19 and IgM expression. Boxes represent CD19+ IgM− and CD19+ IgM+ populations based upon EμLMP2A TgE staining patterns. (B) CD19 and CD43 expression. Boxes represent CD19+ CD43− and CD19+ CD43+ populations in EμLMP2A bone marrow samples as delineated by RAG−/− animals which exhibit only CD19+ CD43+ populations (data not shown). The percentage of lymphocytes expressing CD19 and IgM or expressing CD19 and CD43 are indicated for the specific populations. These data are representative of at least three separate experiments.

