Fig. 2.
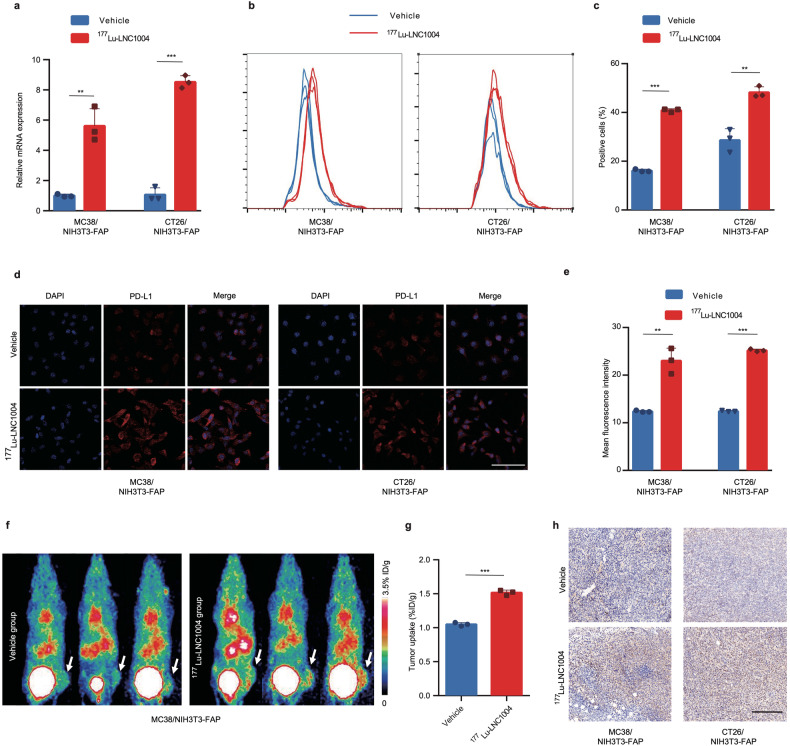
PD-L1 expression is significantly upregulated both in vitro and in vivo after treatment with 177Lu-LNC1004. a Bar plot derived from quantitative RT-PCR used to assess the mRNA levels of PD-L1 in MC38/NIH3T3-FAP and CT26/NIH3T3-FAP cells after 24 h stimulation with 177Lu-LNC1004 (n = 3/group). b, c Representative histograms and bar plot derived from flow cytometry showing the upregulation in PD-L1 expression after 24 h of stimulation with 177Lu-LNC1004 (n = 3/group). d, e Confocal images and bar plot derived from PD-L1 immunofluorescence staining indicate enhanced expression of PD-L1 after 24 h exposure to 177Lu-LNC1004 (n = 3/group). Scale bar: 100 μm. f Representative static PET maximum intensity projection (MIP) images of 68Ga-DOTA-SETSKSF in MC38/NIH3T3-FAP tumor-bearing mice (n = 3/group). g PET quantification data for 68Ga-DOTA-SETSKSF in MC38/NIH3T3-FAP tumor-bearing mice (n = 3/group). h Immunohistochemical staining of PD-L1 in tumor tissues. Scale bar: 200 μm

