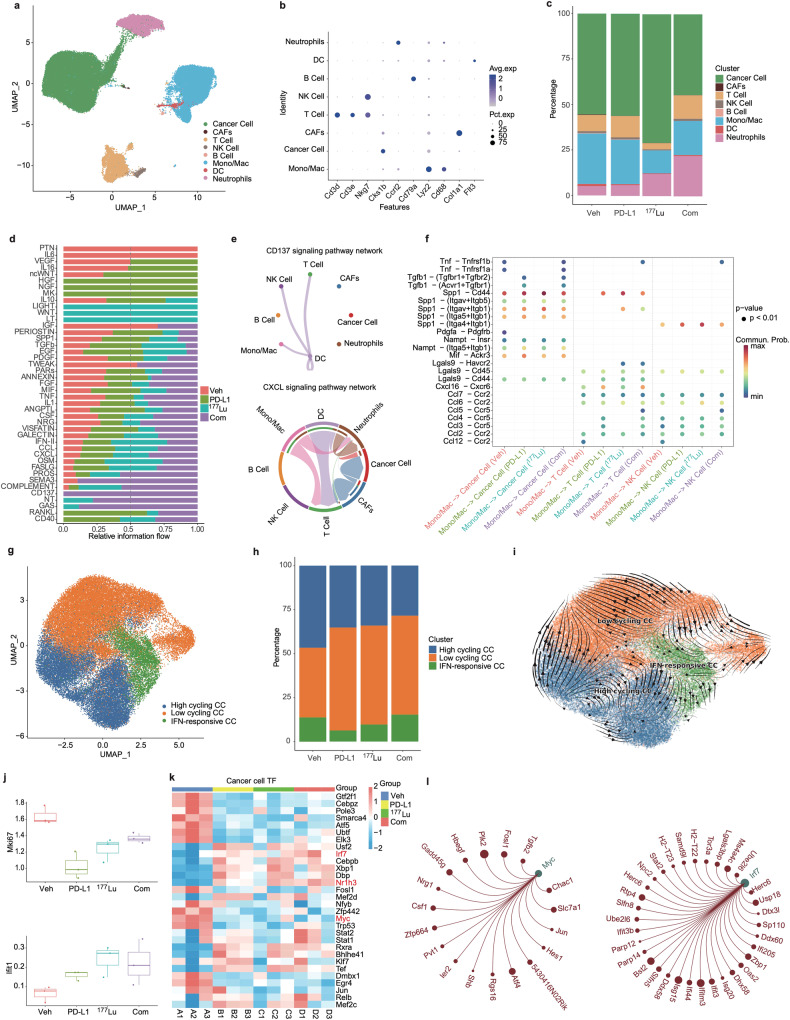
Fig. 4.
Cell type identification and cancer cell characterization in MC38/NIH3T3-FAP tumor models. a UMAP plots of all cells. b Dot plots reveal characteristic marker genes across different cellular fractions. c Bar charts comparing the major cellular lineages across various treatments. d Bar charts depict the varied contribution of pathways to cellular communication. e Interaction networks emphasize specific cell-to-cell interactions via the CD137 (top) and CXCL (bottom) pathways in the combination treatment group. f Highlighted ligand-receptor interactions from Mono/Mac with cancer cells, T-cells, and NK cells, as indicated by CellChat. g UMAP plots of cancer cells. h Bar charts show the distribution of tumor cell subpopulations. i RNA trajectory analysis reflects the evolutionary progression of tumor cells. j Box line plots representing mean Mki67 and Ifit1 expression in cancer cells. k SCENIC analysis delineating differences in AUC values of transcription factors (TFs). l Regulatory network diagram centered on TFs Myc and Irf7

